State of US Healthcare Marketing on Google 2026
State of US Healthcare Marketing on Google 2026: we analyzed public Google Business Profile data for 9,452 US practices in 9 specialties across 20 metros. The average rating is 4.77 stars, 28.7% of practices have fewer than 50 reviews, only 36.2% list weekend hours, and median review counts run from 33 (hair restoration clinics) to 319.5 (dental practices).

- One report combining our 9-specialty Google benchmarks (9,452 practices, 20 metros), our med spa study (555 med spas) and our dental study (2,318 practices).
- Ratings barely separate practices (4.62 to 4.89 stars by specialty). Review depth, weekend access and how a practice handles booking and pricing do.
- Aggregates only: no practice named, no review text quoted, no group under 10 practices reported. Review subsamples are labeled wherever they appear.
- Every practice welcome — retainers from $499/mo, Goals-Driven engagements, Performance-Linked Payout Models available.
- Dallas, Texas LLC
- 10-person US client team · Central Time (CST)
- 25+ US healthcare clients
- BAA signed with every client
- HIPAA compliance training across client and delivery teams
- Contracts and invoices in USD
-
 Primary Care · North Dallas, TXCase study →
-
 MedSpa · North Dallas, TX
-
 Skin Care · Beverly Hills, CA
-
 Dental · Christiansburg, VACase study →
-
 Pediatrics · Blacksburg, VACase study →
-
 Pediatric Dentistry · Blacksburg, VACase study →
-
 Dental · Roanoke, VACase study →
-
 Functional Medicine · Telehealth · USACase study →
“They were able to get all my ideas and work with me over a period of three to four months and create this amazing website. It's super customized, very modern, and it incorporates all the elements that I had wanted — the patient portal, nice pictures, a very interactive website, patient reviews. I would highly recommend their company to anyone who wants to make an excellent website.”
10 headline findings
This report pulls together three pieces of our own research into one view of how US healthcare practices show up on Google in 2026. The backbone is a benchmark of 9,452 practices in 9 specialties across 20 large metros. On top of that sit review-level samples from our med spa and dental studies, which tell us how fast reviews arrive, how often owners reply and what patients actually write about. Each finding below names its sample, and the subsample figures are labeled as such.
- 4.77★
The average US healthcare practice in our study rates 4.77 stars on Google. Specialty averages sit within 0.27 stars of each other, from 4.62 (dermatology practices) to 4.89 (physical therapy clinics).
Benchmarks: 9,452 practices, 9 specialties, 20 metros; practice-weighted · details - 9.7×
Review depth varies far more than ratings. The median dental practice has 319.5 Google reviews; the median hair restoration clinic has 33, a 9.7-fold gap.
Benchmarks: 9,452 practices, 9 specialties, 20 metros; national medians · details - 28.7%
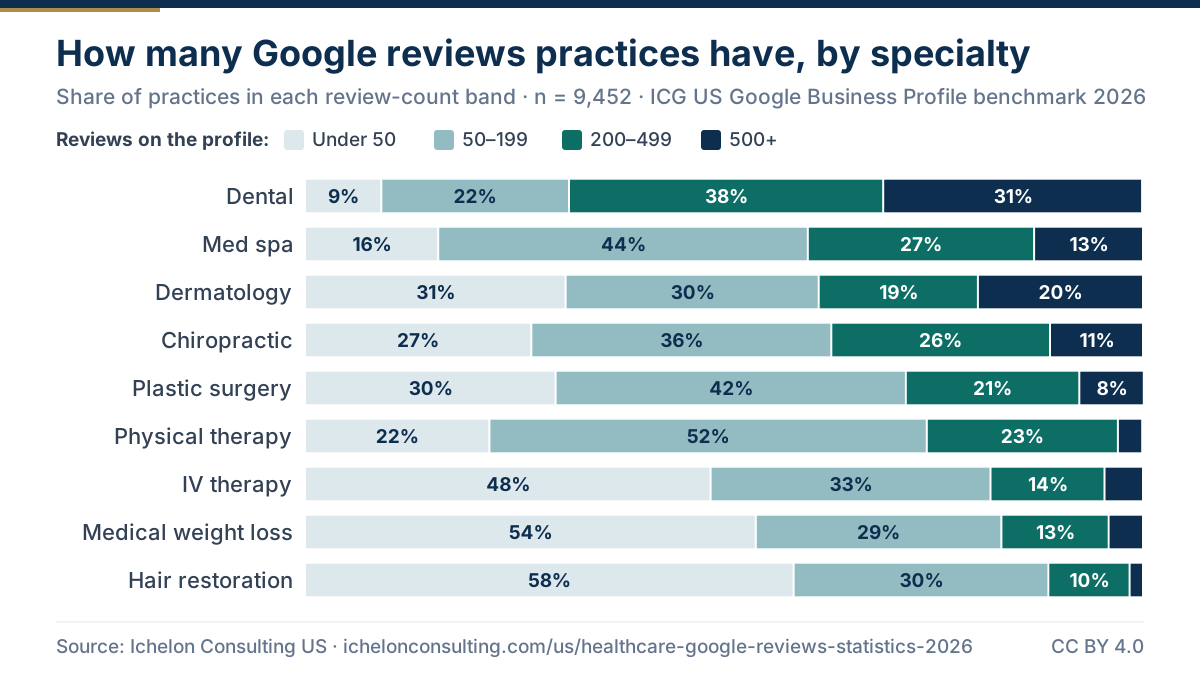
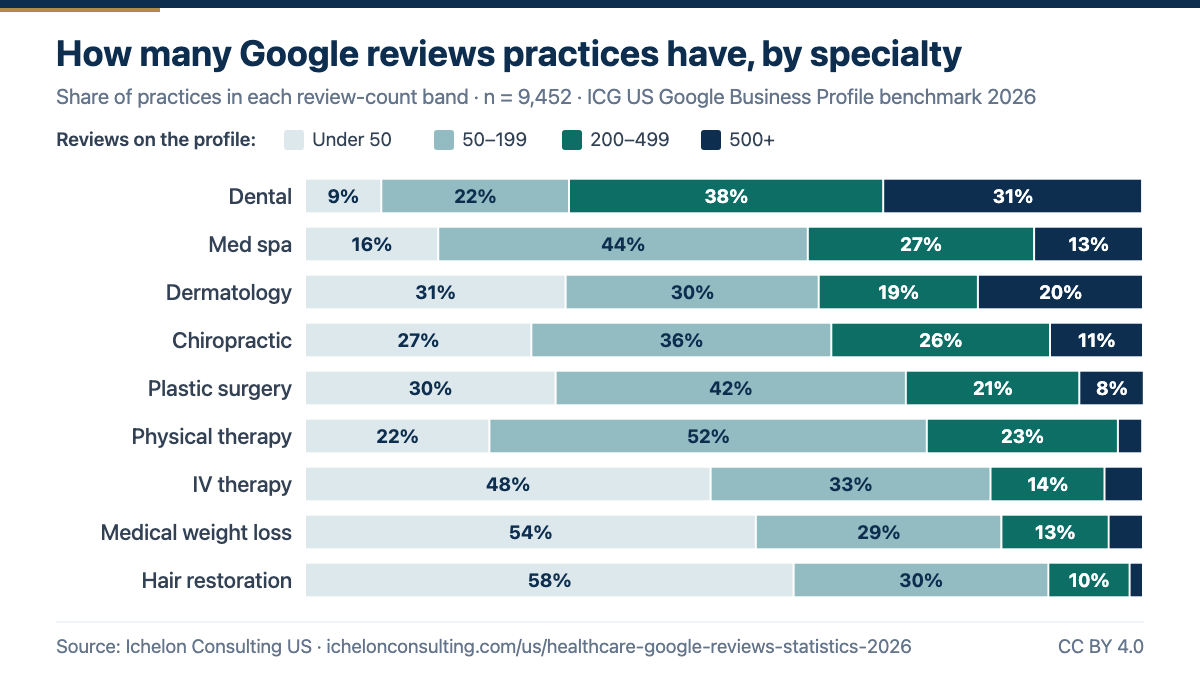
About 28.7% of practices have fewer than 50 Google reviews, and 14.4% have 500 or more. In 2 specialties (medical weight loss clinics and hair restoration clinics) at least half of practices are under 50.
Benchmarks: 9,452 practices, 9 specialties, 20 metros; practice-weighted · details - 96.7%
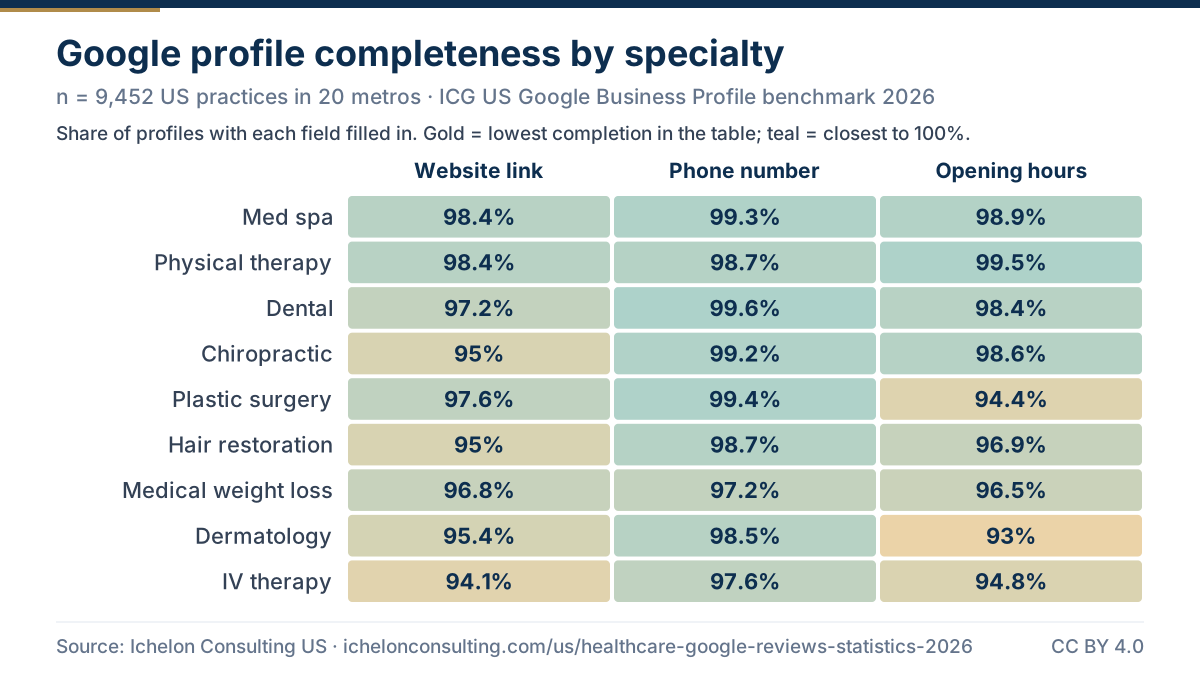
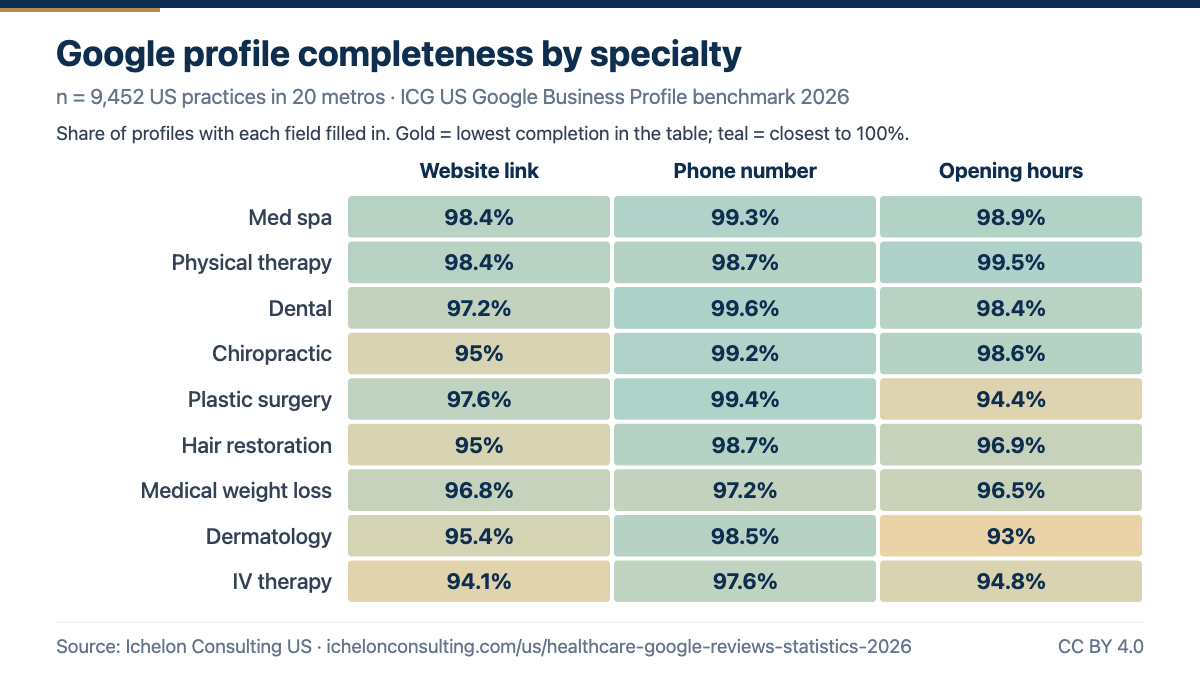
Profiles are mostly complete: 96.3% link a website, 98.8% list a phone number and 96.7% publish hours. Dermatology practices trail on hours at 93%.
Benchmarks: 9,452 practices, 9 specialties, 20 metros; practice-weighted · details - 36.2%
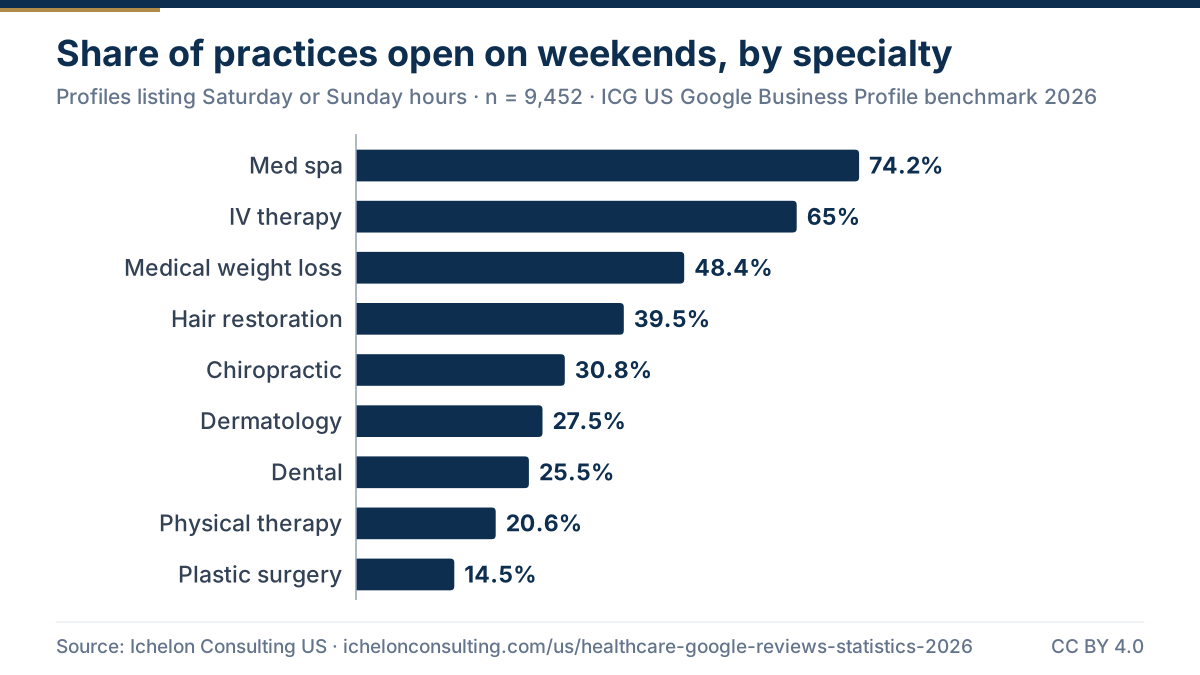
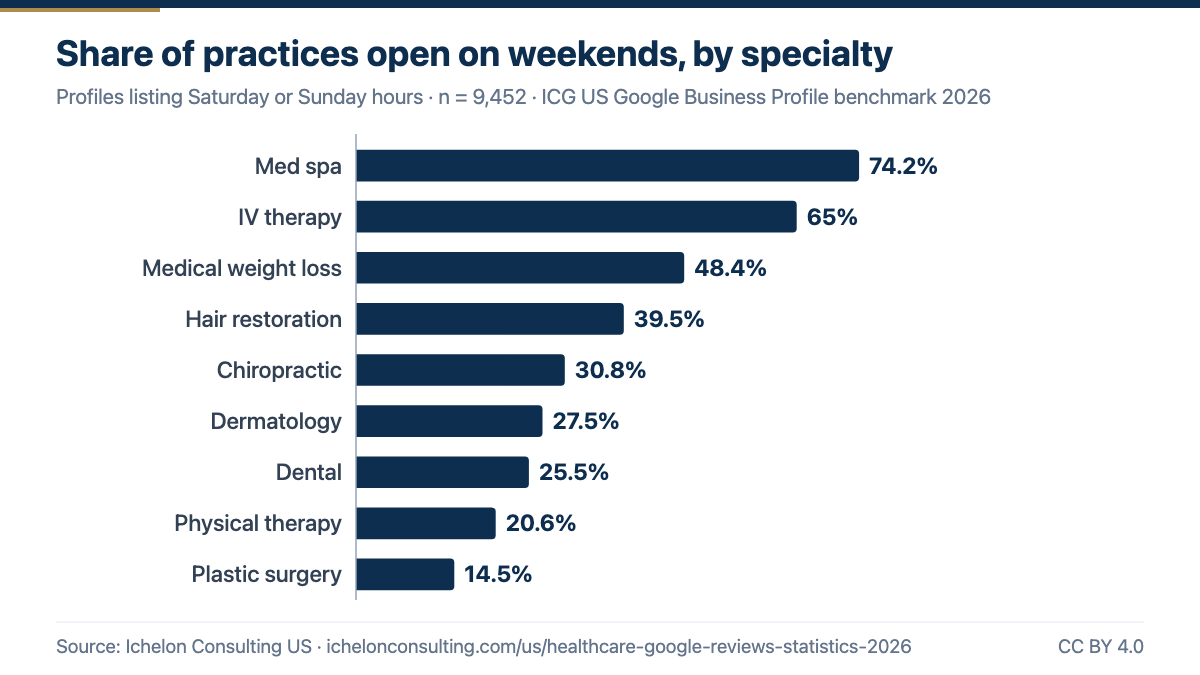
Only 36.2% of practices list weekend hours. The range runs from 74.2% of med spas to 14.5% of plastic surgery practices.
Benchmarks: 9,452 practices, 9 specialties, 20 metros; practice-weighted · details - 1.52×
New York has the deepest review profiles of the 20 metros: its typical practice has 1.52 times the national median for its specialty. San Francisco sits at 0.54×.
178 specialty-by-metro groups, each n ≥ 10 · details - 2 metros
Scottsdale and Denver beat the national median review count in all 9 specialties. San Francisco beat it in none.
178 specialty-by-metro groups, each n ≥ 10 · details - 48% / 61%
Staff and bedside manner is the theme patients write about most: 48% of classified med spa review mentions and 61% of dental mentions, and over 97% of those mentions are positive.
Review subsamples: med spa 2,990 and dental 2,992 classified mentions · details - 73.9%
Complaints cluster around process, not care. 73.9% of dental upselling mentions are negative, and booking and communication is the one med spa theme where negative mentions (54.2%) outnumber positive ones.
Review subsamples; theme percentages are directional · details - 61% / 49%
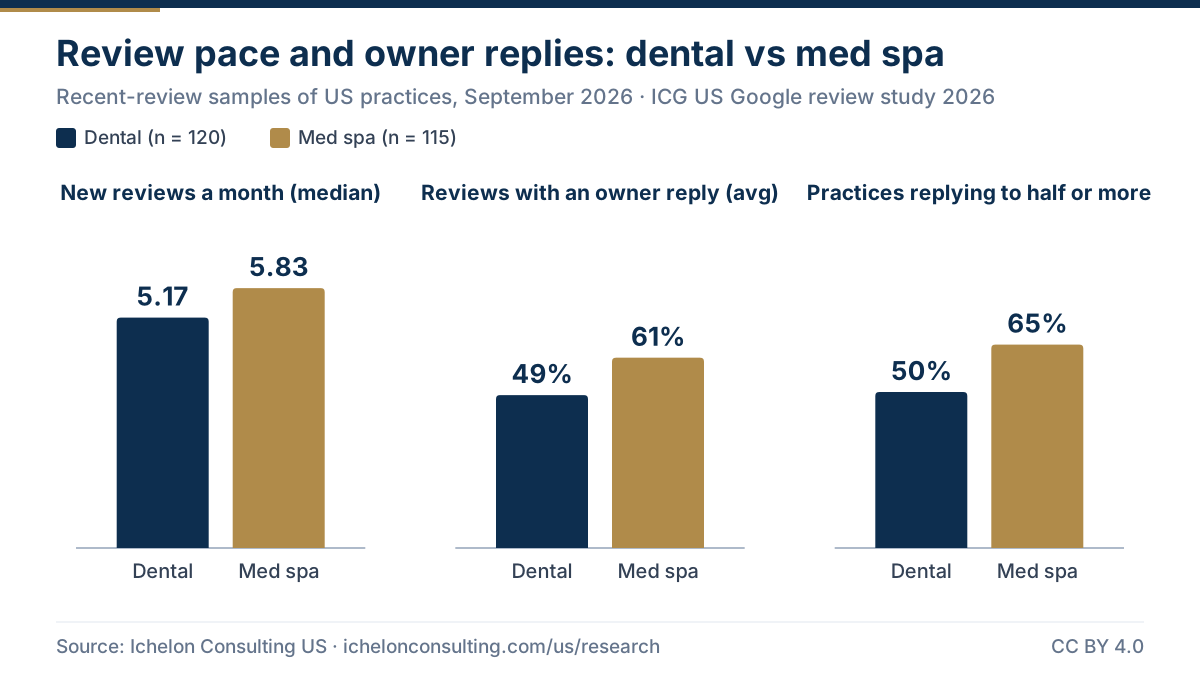
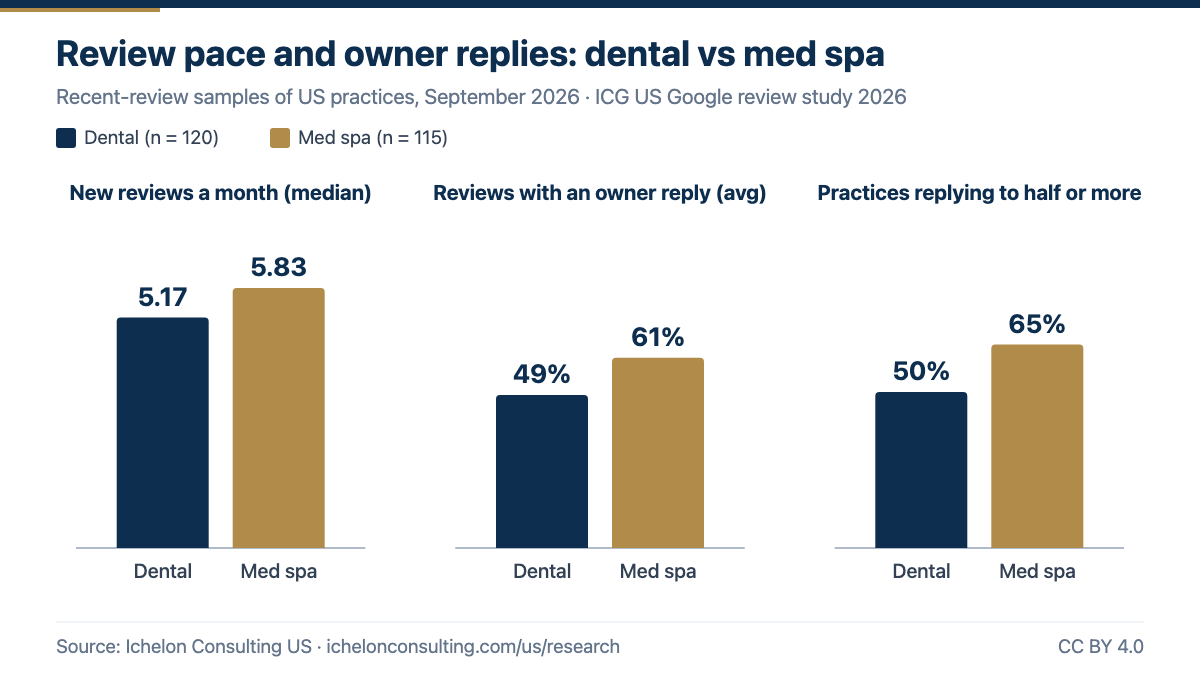
Owners reply to 61% of med spa reviews and 49% of dental reviews on average, while the median practice gains about 5.83 (med spa) and 5.17 (dental) new reviews a month.
Review subsamples: 115 med spas, 120 dental practices · details
The short version: on Google, nearly every practice looks good on stars. Ratings cluster between 4.62 and 4.89 in every specialty, so they no longer separate one practice from another. What does separate them is review depth, which varies 9.7-fold between specialties and widely between cities; whether the practice is open when patients are free to come in; and whether the non-clinical parts of the visit, such as booking, pricing and follow-up, match what patients were led to expect.
The US healthcare Google landscape across 9 specialties
The table below is the reference point for the rest of the report. Each row is the national figure for one specialty, built from the practices we found in all 20 metros. Specialties are sorted by median review count, because that is where they differ most. Each specialty name links to its city-by-city benchmark page, and the last column links to its full statistics page.
| Specialty | Practices | Avg rating | Median reviews | Under 50 | 500+ | Website | Hours listed | Weekends | Days open / wk | Statistics |
|---|---|---|---|---|---|---|---|---|---|---|
| Dental | 2,318 | 4.79 | 319.5 | 9.1% | 30.9% | 97.2% | 98.4% | 25.5% | 4.8 | View |
| Med Spa | 555 | 4.87 | 148 | 15.9% | 13% | 98.4% | 98.9% | 74.2% | 5.6 | View |
| Dermatology | 1,330 | 4.62 | 125 | 31.1% | 19.7% | 95.4% | 93% | 27.5% | 4.8 | View |
| Chiropractic | 1,035 | 4.77 | 125 | 27% | 11.1% | 95% | 98.6% | 30.8% | 4.9 | View |
| Physical Therapy | 854 | 4.89 | 122 | 22% | 2.9% | 98.4% | 99.5% | 20.6% | 5.1 | View |
| Cosmetic & Plastic Surgery | 874 | 4.74 | 107 | 29.9% | 7.7% | 97.6% | 94.4% | 14.5% | 4.8 | View |
| IV Therapy & Wellness | 1,535 | 4.81 | 52 | 48.4% | 4.6% | 94.1% | 94.8% | 65% | 5.5 | View |
| Medical Weight Loss | 632 | 4.79 | 42 | 53.8% | 4.1% | 96.8% | 96.5% | 48.4% | 5 | View |
| Hair Restoration | 319 | 4.74 | 33 | 58.3% | 1.6% | 95% | 96.9% | 39.5% | 5.1 | View |
| All 9 (practice-weighted) | 9,452 | 4.77 | — | 28.7% | 14.4% | 96.3% | 96.7% | 36.2% | 5 | View |
Source: public Google Business Profile data, September 2026. "All 9" weights each specialty's national figure by its number of practices. We do not pool medians across specialties, so there is no combined median review count.
Star ratings: high everywhere, so they rarely decide the click
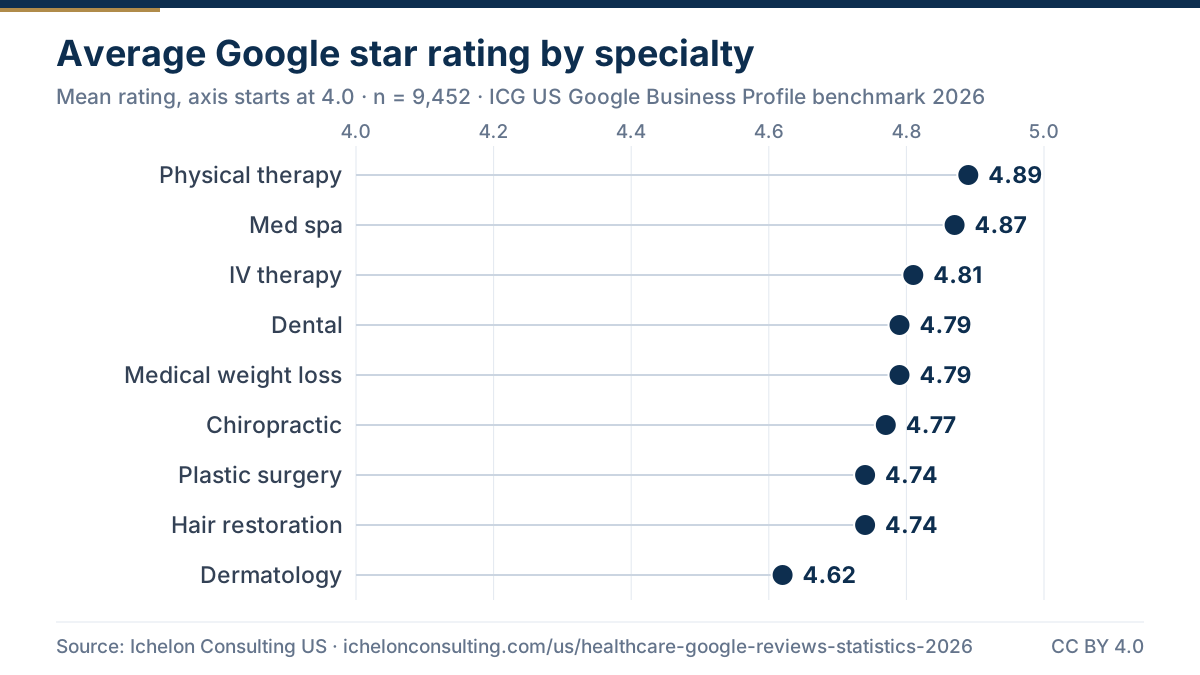
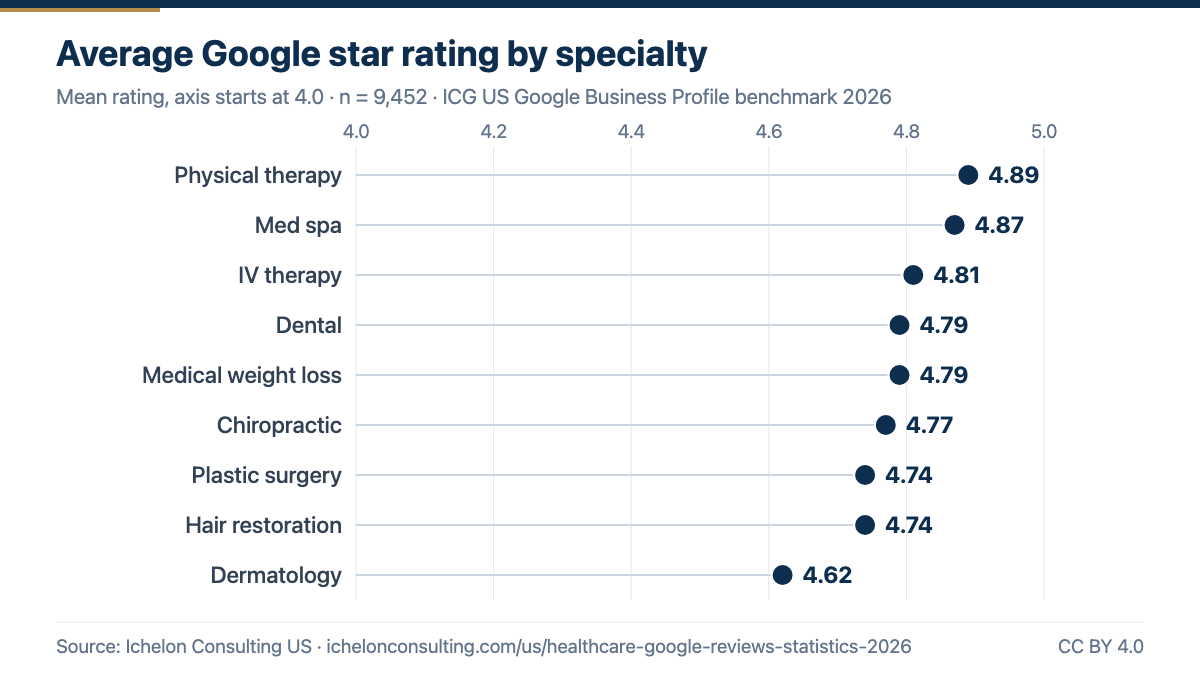
Across all 9,452 practices, the practice-weighted average Google rating is 4.77 stars. 6 of the 9 specialties average 4.75 or higher. Physical therapy clinics rate highest at 4.89, and dermatology practices lowest at 4.62. That is a spread of just 0.27 stars between the best- and worst-rated specialty.
The city view tells the same story. Of the 178 specialty-and-metro groups with at least 10 practices, 22 average 4.9 stars or higher, and only 4 average below 4.5. When a patient compares three or four practices in the map pack, most of them will show a rating between 4.7 and 5.0. A rating in that band is the price of entry, not a reason to choose you.
Two things follow. First, a rating that falls below your specialty's average stands out far more than one that sits above it, because patients are used to seeing high numbers. Second, ratings and review volume do not move together. Physical therapy clinics have the highest average rating of the nine specialties, yet rank 5 of 9 on median review count. A high average built on a thin set of reviews looks less settled than a slightly lower average built on hundreds.
Use this chart
Paste this HTML into your article or blog post. Please keep the source link.
Review volume: where specialties really differ
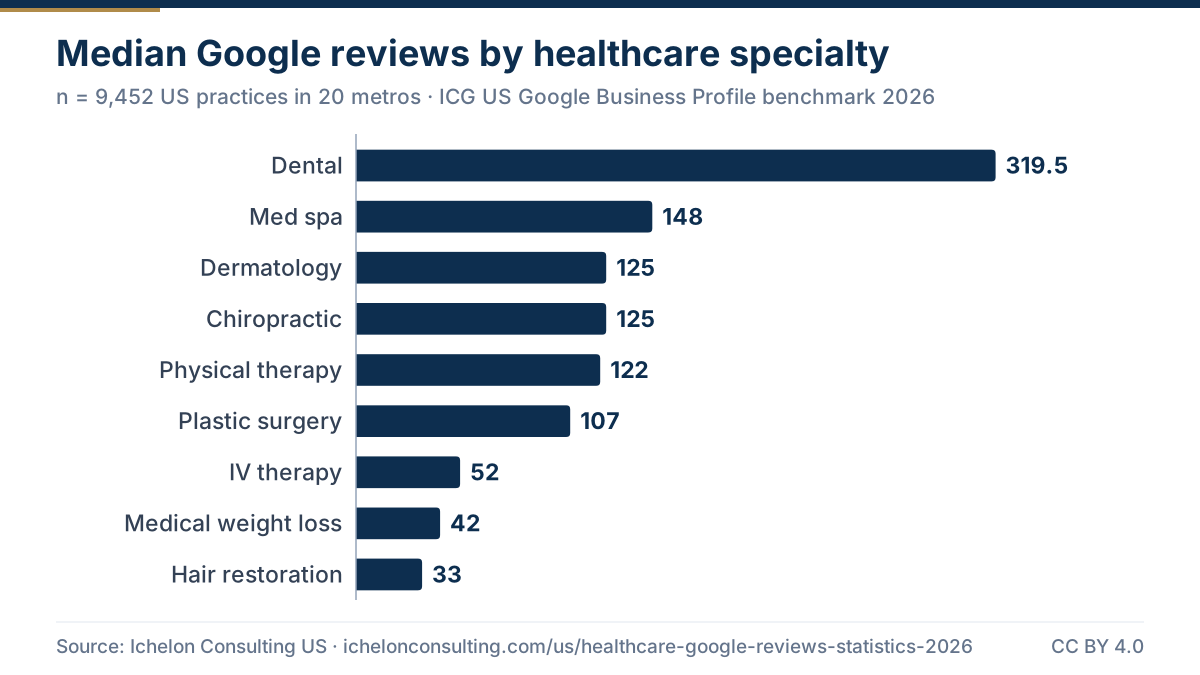
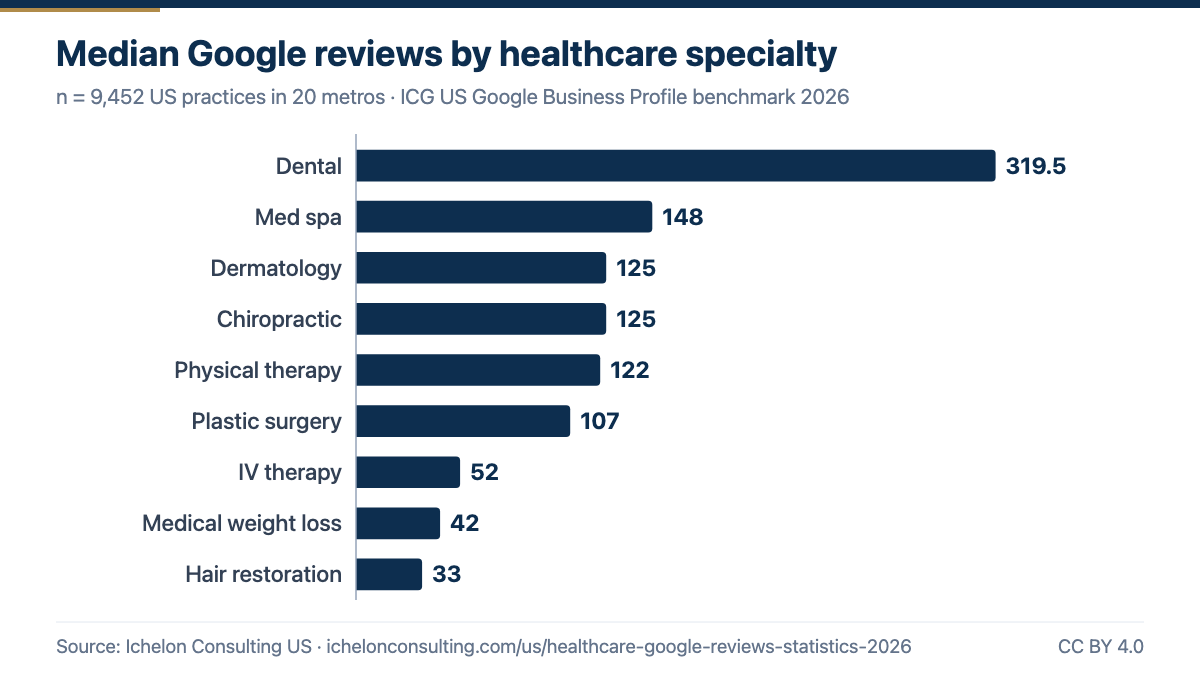
Review counts are where the real gaps are. The median dental practice has 319.5 Google reviews. The median hair restoration clinic has 33. In 3 of the 9 specialties (IV therapy and wellness clinics, medical weight loss clinics and hair restoration clinics), the typical practice has fewer than 100 reviews. We report medians rather than averages here, because a handful of very large practices pull averages up and make the typical practice look busier than it is.
The review-count bands make the shape of the market clearer. Across all practices, 28.7% have fewer than 50 reviews, 33.2% have 50 to 199, 23.7% have 200 to 499, and 14.4% have 500 or more. Specialty matters a great deal: 58.3% of hair restoration clinics sit under 50 reviews, against 9.1% of dental practices. At the top end, 30.9% of dental practices have 500 or more reviews, compared with 1.6% of hair restoration clinics.
For a practice owner, this means "how many reviews do we need?" has no single answer. A hair restoration clinic with 80 reviews is already above its national median. A dental practice with 80 is in the bottom third. The practical target is your own specialty's median in your own metro, which the benchmark tables and the review benchmark checker give you directly.
Use this chart
Paste this HTML into your article or blog post. Please keep the source link.
Use this chart
Paste this HTML into your article or blog post. Please keep the source link.
Profile completeness: the basics are mostly done
Most practices have filled in the fields a patient checks before calling. Practice-weighted, 96.3% link a website from their Google Business Profile, 98.8% list a phone number and 96.7% publish opening hours. The weakest specialty on websites is IV therapy and wellness clinics at 94.1%. On hours, dermatology practices trail at 93%, while physical therapy clinics lead at 99.5%.
Because nearly everyone has the basics, completeness is now a floor rather than an advantage. A profile without hours in a specialty where 97 in 100 competitors list them looks neglected, and patients read that as a signal about the practice itself. The work that still separates profiles is less visible in a field-count audit: accurate categories, current photos, service lists that match what patients search for, and hours that are kept up to date around holidays.
Use this chart
Paste this HTML into your article or blog post. Please keep the source link.
Weekend access: the clearest gap between specialties
Only 36.2% of practices list at least one weekend day on Google. Behind that average sit two different markets. Cash-pay aesthetic and wellness businesses keep weekend hours as a matter of course: 74.2% of med spas and 65% of IV therapy and wellness clinics do. Most clinical specialties do not: 25.5% of dental practices, 27.5% of dermatology practices, 20.6% of physical therapy clinics and 14.5% of plastic surgery practices. 2 of the 9 specialties have a majority open on weekends.
Days open per week follow the same split, from 5.6 days for med spas to 4.8 for dental practices. The metro view adds another layer: practice-weighted across specialties, Los Angeles (51%) and New York (50.8%) have the highest weekend share, and Austin (27.2%) the lowest.
For a clinical practice in a specialty where most competitors close on Saturday, weekend hours are one of the few remaining ways to stand apart on the profile itself. Google surfaces "open now" prominently, and a weekend search for a dentist or dermatologist returns far fewer open options. Even a half day, published accurately, changes which practices a weekend searcher sees as available.
Use this chart
Paste this HTML into your article or blog post. Please keep the source link.
Which metros are the most competitive on Google reviews
Raw review counts cannot be compared across specialties, because a dental median and a hair restoration median live on different scales. To rank metros fairly, we built a simple review-depth index. For each specialty a metro reports, we divide the metro's median review count by that specialty's national median. The index is the median of those ratios. An index of 1.5 means the typical practice in that metro has about one and a half times the national review count for its specialty, so a new or smaller practice there has more ground to make up. Only specialty-and-metro groups with 10 or more practices are included (178 groups in all).
New York comes out on top at 1.52×, followed by Houston (1.41×), Scottsdale (1.29×), Denver (1.22×) and Miami (1.21×). Scottsdale and Denver are above the national median in every one of the 9 specialties. At the other end, San Francisco (0.54×), Seattle (0.69×) and Los Angeles (0.7×) have the thinnest review profiles relative to their specialties, and San Francisco is below the national median in all 9 specialties it reports.
| # | Metro | Review-depth index | Specialties above national median | Practices | 500+ reviews | Weekends | Avg rating |
|---|---|---|---|---|---|---|---|
| 1 | New York | 1.52× | 8 of 9 | 555 | 22% | 50.8% | 4.78 |
| 2 | Houston | 1.41× | 6 of 9 | 513 | 18.5% | 41.9% | 4.81 |
| 3 | Scottsdale | 1.29× | 9 of 9 | 493 | 19.1% | 32.4% | 4.86 |
| 4 | Denver | 1.22× | 9 of 9 | 477 | 17.6% | 30.8% | 4.78 |
| 5 | Miami | 1.21× | 6 of 9 | 481 | 17.5% | 40.8% | 4.81 |
| 6 | Atlanta | 1.12× | 6 of 9 | 481 | 16.2% | 30.3% | 4.73 |
| 7 | Orlando | 1.09× | 5 of 9 | 520 | 18.3% | 28.9% | 4.8 |
| 8 | Las Vegas | 1.05× | 6 of 9 | 459 | 18.7% | 33.3% | 4.77 |
| 9 | Austin | 1.05× | 6 of 9 | 460 | 15.2% | 27.2% | 4.83 |
| 10 | Chicago | 1.04× | 6 of 9 | 503 | 14.1% | 45.5% | 4.74 |
| 11 | Dallas | 1× | 4 of 9 | 483 | 15.1% | 34.6% | 4.78 |
| 12 | Washington DC | 0.93× | 3 of 9 | 489 | 13.3% | 37.6% | 4.78 |
| 13 | Boston | 0.92× | 3 of 9 | 470 | 6.2% | 36.4% | 4.74 |
| 14 | Philadelphia | 0.91× | 3 of 9 | 487 | 10.7% | 31.6% | 4.73 |
| 15 | Phoenix | 0.81× | 3 of 7 | 225 | 16% | 34.2% | 4.82 |
| 16 | San Diego | 0.78× | 2 of 9 | 483 | 10.6% | 37.1% | 4.75 |
| 17 | Nashville | 0.75× | 3 of 9 | 441 | 13.6% | 30.1% | 4.76 |
| 18 | Los Angeles | 0.7× | 1 of 9 | 539 | 10.2% | 51% | 4.8 |
| 19 | Seattle | 0.69× | 1 of 9 | 442 | 6.3% | 28% | 4.69 |
| 20 | San Francisco | 0.54× | 0 of 9 | 440 | 7% | 32.5% | 4.7 |
Index = median across reported specialties of (metro median reviews ÷ national median reviews). "500+ reviews", "Weekends" and "Avg rating" are practice-weighted across the metro's reported specialties. Phoenix reports 7 of 9 specialties; the rest fall under the 10-practice minimum.
The deepest and thinnest markets, specialty by specialty
The single deepest group we measured is dermatology practices in New York, with a median of 513.5 Google reviews (74 practices). The thinnest is hair restoration clinics in Seattle, with a median of 4 (15 practices). New York and Houston each have the highest median review count of any metro in 3 specialties, and Seattle, San Diego, Philadelphia and San Francisco each have the lowest in 2. Ties count for each city.
| Specialty | Metros reported | Deepest metro (median) | Thinnest metro (median) | Benchmarks |
|---|---|---|---|---|
| Med Spa | 19 | San Diego (289.5) | Las Vegas (58.5) | City table |
| Dental | 20 | New York (441) | Seattle (219) | City table |
| Dermatology | 20 | New York (513.5) | San Diego (43) | City table |
| Cosmetic & Plastic Surgery | 20 | Miami (295) | San Diego (20) | City table |
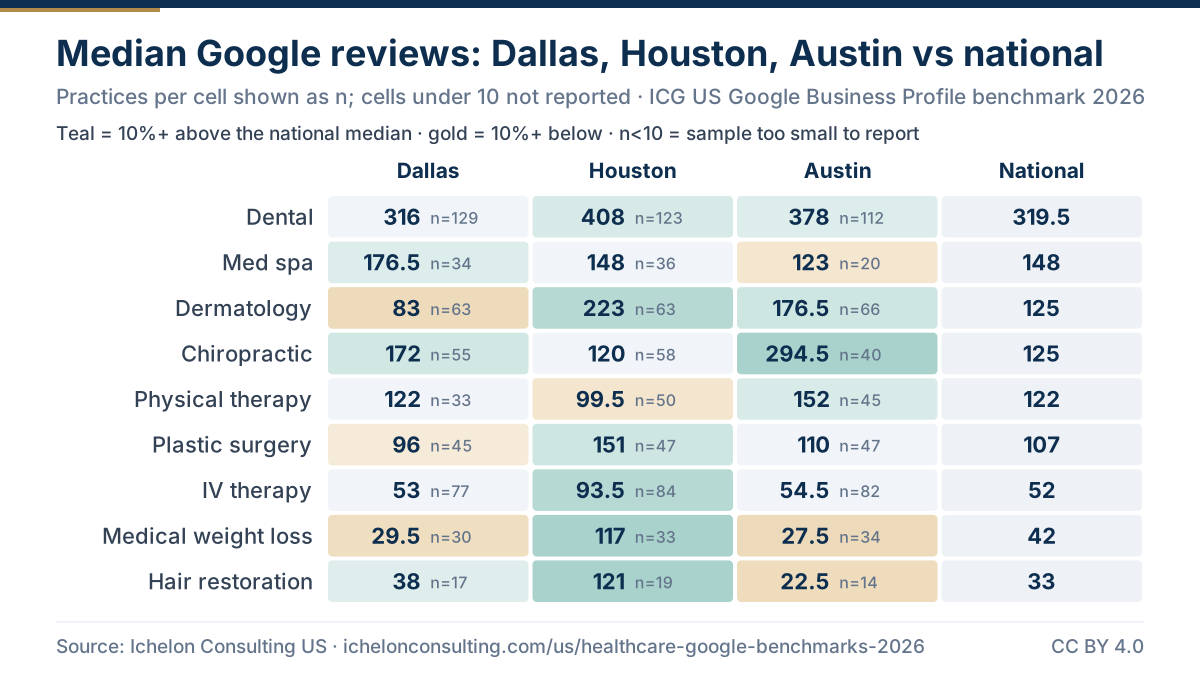
| IV Therapy & Wellness | 20 | Houston (93.5) | Philadelphia (23) | City table |
| Medical Weight Loss | 20 | Houston (117) | San Francisco (13) | City table |
| Hair Restoration | 19 | Houston (121) | Seattle (4) | City table |
| Chiropractic | 20 | Austin (294.5) | Philadelphia (54) | City table |
| Physical Therapy | 20 | New York and Seattle (215) | San Francisco (79) | City table |
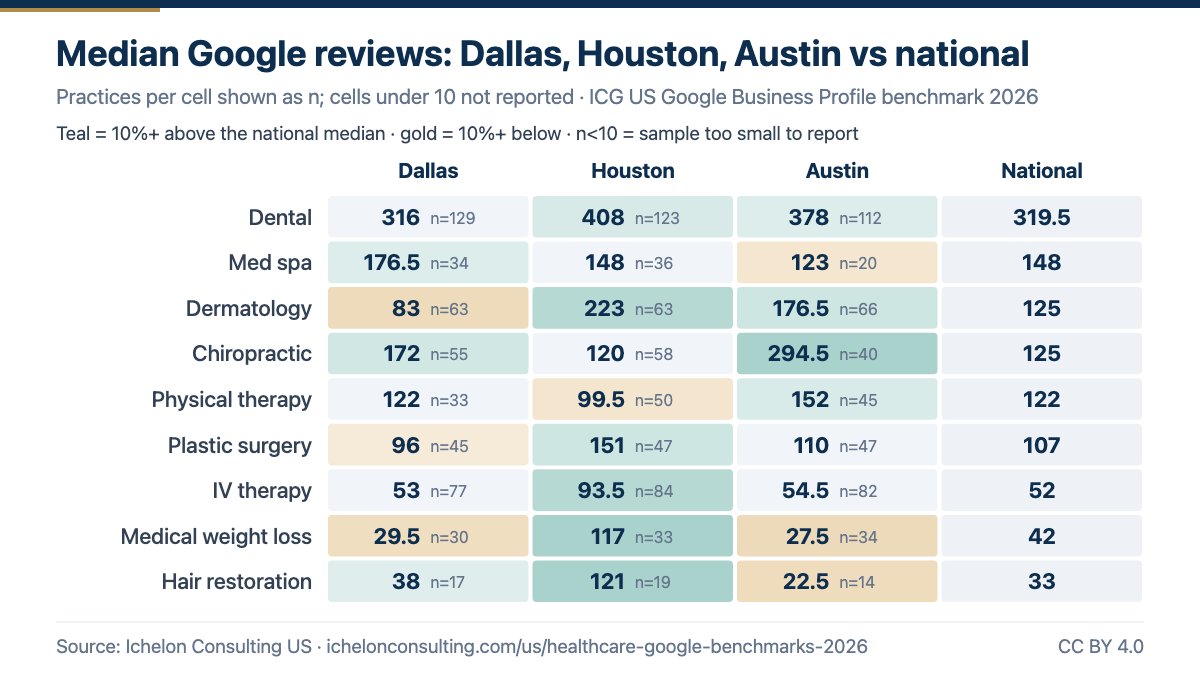
Two patterns are worth noting. First, a metro that is deep in one specialty is not always deep in all of them, so national rankings of "competitive cities" are only a starting point. Second, the metros with the thinnest review profiles are not necessarily easy markets. Thin review profiles may reflect how patients in that metro choose providers, so check paid search and directory competition there too before assuming the market is open. For Texas specifically, the chart below compares Dallas, Houston and Austin with the national median in each specialty.
Use this chart
Paste this HTML into your article or blog post. Please keep the source link.
How fast reviews arrive, and how often owners reply
Subsample: 115 med spas and 120 dental practices, national onlyReview counts show the past. Review pace and replies show what a practice is doing now. These figures come from review-level samples in our two full studies, not from the 9,452-practice benchmark, and they are national figures only because the samples are too small to split by city.
| Sample | Practices sampled | Median new reviews / month | Average owner reply rate | Practices replying to half or more |
|---|---|---|---|---|
| Med spas | 115 | 5.83 | 61% | 65.2% |
| Dental practices | 120 | 5.17 | 49% | 50% |
The typical med spa in the sample gains about 5.83 new Google reviews a month and the typical dental practice about 5.17. That is a little over one a week. It is a useful reality check: a practice that adds ten good reviews a month is out-pacing most of its market, and the gap compounds over a year. Pace is measured from the most recent reviews pulled per profile, so for very busy profiles it is a floor rather than an exact count.
On replies, owners answer 61% of med spa reviews and 49% of dental reviews on average. 65.2% of med spas and 50% of dental practices reply to at least half of their reviews. Put the other way, a large share of practices leave most of their reviews unanswered, which is an easy gap to close. Replies in healthcare need care: thank the reviewer, never confirm that someone is a patient, and move any problem to a private channel.
Use this chart
Paste this HTML into your article or blog post. Please keep the source link.
What patients praise, and what they complain about
Subsamples: 2,990 classified med spa review mentions (115-spa sample) and 2,992 classified dental review mentions (national sample)To understand what drives a rating, we classified Google reviews from our med spa and dental studies into nine themes, each with a positive, negative or neutral sentiment. Each review was assigned one primary theme by a language model. Treat the percentages as directional: they describe the pattern well, but a second classification run will not reproduce every count exactly. These two samples cover med spas and dental practices only; we have not classified reviews for the other seven specialties.
| Theme | Med spa (2,990 mentions) | Dental (2,992 mentions) | ||||
|---|---|---|---|---|---|---|
| Share of mentions | Positive | Negative | Share of mentions | Positive | Negative | |
| Staff & bedside manner | 48% (1,422) | 98.6% | 1.2% | 61% (1,829) | 97.5% | 2.2% |
| Results | 34% (1,016) | 97.8% | 2% | 9% (270) | 91.5% | 7.8% |
| Pain & comfort | 4% (126) | 99.2% | 0% | 8% (250) | 96.8% | 3.2% |
| Price & value | 4% (107) | 84.1% | 15.9% | 4% (113) | 56.6% | 42.5% |
| Wait time & scheduling | 2% (52) | 80.8% | 17.3% | 5% (158) | 81% | 17.1% |
| Cleanliness | 3% (102) | 98% | 2% | 3% (100) | 94% | 6% |
| Before / after outcome | 2% (69) | 79.7% | 20.3% | 4% (126) | 95.2% | 4% |
| Booking & communication | 2% (48) | 41.7% | 54.2% | 3% (100) | 58% | 40% |
| Upselling | 2% (48) | 81.3% | 16.7% | 2% (46) | 26.1% | 73.9% |
Share = theme mentions ÷ all classified mentions in that sample, rounded. Positive and negative do not always sum to 100% because some mentions are neutral. Several themes have fewer than 150 mentions, so small differences between them should not be over-read.
What patients praise
The care itself. Staff and bedside manner is the most-mentioned theme in both samples, at 48% of med spa mentions and 61% of dental mentions, and it is 98.6% and 97.5% positive respectively. Results come second for med spas (34% of mentions, 97.8% positive). In dental, pain and comfort (96.8% positive) and results (91.5% positive) follow. Cleanliness is rarely mentioned but almost always praised when it is.
What patients complain about
The process around the care. In dental, upselling is 73.9% negative and price and value 42.5% negative, with booking and communication at 40%. For med spas, booking and communication is the only theme where complaints outnumber praise (54.2% negative), and before-and-after outcomes (20.3% negative) and wait time and scheduling (17.3% negative) carry the next-highest complaint rates.
The pattern is consistent across both samples. Patients rarely fault the clinician; they fault the parts of the visit that sit around the clinician. A surprise charge, a treatment plan that feels like a sales pitch, a call that never came back or a result that did not match the photos on the website all produce the negative reviews that pull an otherwise strong rating down. Those are operational problems with marketing consequences, and they are fixable. For more depth, see the med spa consumer behavior report and the dental patient experience report, both free.
10 things practice owners should do with these numbers
- Benchmark against your specialty and metro, not the internet. Median review counts run from 33 to 319.5 by specialty, and metro gaps are just as wide. Find your row in the benchmark tables and set the first target as your local median.
- Treat review pace as the number to manage. The median practice in our samples adds about 5.17 to 5.83 reviews a month. Ask every patient, the same way, at the same point in the visit, and track the monthly count rather than the total.
- Stop chasing a perfect 5.0. Specialty averages sit within 0.27 stars of each other. A steady flow of recent reviews does more for trust than a flawless score on a thin profile.
- Reply to every review, carefully. Owners answer only 49% (dental) to 61% (med spa) of reviews on average. Thank the reviewer, never confirm someone is a patient or mention their care, and take problems offline.
- Fix the booking experience before buying more ads. Booking and communication is the one med spa theme with more complaints than praise. Every unanswered call or slow callback becomes a lost patient and, sometimes, a one-star review.
- Make pricing and treatment plans easy to understand. In dental reviews, upselling is 73.9% negative and price and value 42.5% negative. Clear estimates and written plans prevent the complaints that cost the most stars.
- Set honest expectations in your before-and-after content. 20.3% of med spa outcome mentions are negative. Use typical results, not best cases, and explain recovery and number of sessions.
- Use weekend hours as a differentiator where competitors close. Only 25.5% of dental practices and 14.5% of plastic surgery practices list weekend hours. If you open Saturdays, make sure Google shows it.
- Keep the profile current, not just complete. With 96.7% of practices listing hours and 96.3% linking a website, completeness is the floor. Holiday hours, current photos, accurate categories and service lists are where profiles still fall short.
- Plan for your metro's depth. In metros with a high review-depth index, such as New York and Houston, closing the review gap takes longer, so budget for a 12-month review program alongside paid search. In thinner markets, a consistent request process can move you into the top tier faster.
Get your practice benchmarked against this report
Our US team compares your Google rating, review count, review pace, replies, hours and profile with your specialty and metro, then sends a short list of what to fix first. Engagements start from $499/month, custom-scoped, with Goals-Driven engagements and Performance-Linked Payout Models available.
The research behind this report
Statistics by specialty
- Med Spa marketing statistics 2026
- Dental marketing statistics 2026
- Dermatology marketing statistics 2026
- Cosmetic & Plastic Surgery marketing statistics 2026
- IV Therapy & Wellness marketing statistics 2026
- Medical Weight Loss marketing statistics 2026
- Hair Restoration marketing statistics 2026
- Chiropractic marketing statistics 2026
- Physical Therapy marketing statistics 2026
- Healthcare Google reviews statistics 2026
Google benchmarks by specialty
Full studies and reports
How we built this report
- Benchmark sample (9,452 practices). Public Google Business Profile data for practices found through Google searches in 20 large US metros (New York, Los Angeles, Chicago, Houston, Dallas, Phoenix, Philadelphia, San Diego, San Francisco, Austin, Miami, Atlanta, Boston, Seattle, Denver, Washington DC, Las Vegas, Nashville, Orlando and Scottsdale), collected in September 2026. 9 specialties: dental (2,318), med spa (555), dermatology (1,330), chiropractic (1,035), physical therapy (854), cosmetic & plastic surgery (874), iv therapy & wellness (1,535), medical weight loss (632), hair restoration (319).
- Measures. Average Google rating, median review count, review-count bands (under 50, 50 to 199, 200 to 499, 500 or more), whether a website, phone number and hours are listed, whether any weekend day is listed as open, and average days open per week.
- Cross-specialty figures. Figures labeled "practice-weighted" weight each specialty's national figure by its number of practices. Medians are never pooled across specialties.
- Metro figures. Only specialty-and-metro groups with 10 or more practices are reported (178 groups). The review-depth index is the median across a metro's reported specialties of its median review count divided by the specialty's national median.
- Review pace and replies (subsample). From review-level samples of 115 med spas and 120 dental practices. Pace is reviews dated in the last six months divided by six (national median); reply rate is the share of a profile's pulled reviews with an owner response (national mean). National only.
- Review themes (subsample). 2,990 med spa and 2,992 dental review mentions, each assigned one primary theme and a sentiment by a language model (Google Gemini). Percentages are directional; the published figures come from an independent validation pass.
- Limitations. Discovery was seeded on 20 large metros, so small towns and rural practices are under-represented. Practices were found through Google searches, so listings that do not surface for the search terms may be missed. Review pace is capped by the number of reviews pulled per profile. Theme and reply figures cover two specialties only and cannot be split by city. Ratings and review counts change daily; these figures are a September 2026 snapshot.
- Publishing rules. Aggregates only. No practice is named, no review text is quoted and no group under 10 practices is reported. Full methods: med spa and dental methodology pages.
How to cite this report
Our aggregates are free to reuse under CC BY 4.0. Please credit Ichelon Consulting Group and link to this page. To cite one headline finding, link its anchor, for example https://ichelonconsulting.com/us/state-of-us-healthcare-marketing-2026#finding-1.
Embed our charts: every chart on this page has a “Use this chart” box with copy-ready HTML that links back here as the source. PNG and SVG files are free to reuse with that credit link.
Related pages from the US team
Google benchmarks for 9 specialties
Find your specialty and city row.
Healthcare Google reviews statistics 2026
Every citable review figure with its source.
Google review benchmark checker
Compare your own rating and review count.
US research library
All of our US studies, reports and guides.
Every practice welcome — Goals-Driven engagements from $499/mo
We benchmark your last 90 days, agree monthly goals with you, and track them live on Ichelon Agency OS with a report every Monday. Performance-Linked Payout Models are available. Our US leadership is based in Dallas, and strategy calls run in US business hours.
Common questions
What is the State of US Healthcare Marketing on Google 2026?
It is a combined market report from Ichelon Consulting Group built on our own September 2026 research: public Google Business Profile data for 9,452 US practices in 9 specialties and 20 metros, plus review-level subsamples from our med spa and dental studies. It reports aggregates only and names no practice.
What is the average Google rating for a US healthcare practice?
4.77 stars, practice-weighted across 9 specialties. Specialty averages range from 4.62 for dermatology practices to 4.89 for physical therapy clinics.
How many Google reviews does a typical US practice have?
It depends heavily on specialty. The median runs from 33 reviews for hair restoration clinics to 319.5 for dental practices. Across all 9,452 practices, about 28.7% have fewer than 50 reviews and 14.4% have 500 or more.
Which US metro is most competitive on Google reviews?
By our review-depth index, New York (1.52 times the national specialty median), followed by Houston (1.41×) and Scottsdale (1.29×). San Francisco has the thinnest review profiles at 0.54×.
What do patients complain about most in Google reviews?
In our review subsamples, complaints concentrate on process: upselling (73.9% negative in dental), price and value (42.5% negative in dental) and booking and communication (54.2% negative for med spas). Care itself, meaning staff, results and comfort, is overwhelmingly praised. These percentages are directional.
Can I cite or reuse this report?
Yes. Our aggregates are free to reuse under CC BY 4.0 with a credit link to this page. The suggested citation is in the "How to cite" section.
A note on this guide: it explains marketing practice, not legal advice. Rules on privacy, advertising and insurance change and vary by state, so confirm anything compliance-related with your own counsel.
See where your practice stands against this report
A free 30-minute call with the US team. We compare your Google rating, review count, hours and replies with your specialty and metro, and tell you what we would fix first.
Articles from this research
Questions people search for, answered with figures from this report.
Common questions
What are the biggest healthcare marketing trends right now?
The biggest shifts are AI Overviews and chatbots answering health questions, which rewards cited expert content; Google review volume deciding local choice; closer HIPAA scrutiny of tracking pixels; Meta's limits on health advertisers' data; short-form video from clinicians; and practices measuring cost per booked visit instead of leads. Consolidation into multi-location groups is also raising competition in many metros.