Physical Therapy Marketing Statistics 2026
Physical therapy marketing statistics for 2026: the average US physical therapy clinic holds a 4.89-star Google rating, the highest of 9 specialties we studied, with a median of 122 reviews; only 20.6% open on weekends. Every state allows some direct access, and BLS projects 12% job growth to 2035.

- 44 statistics: 29 from our September 2026 Google study of 854 US physical therapy clinics in 20 metros, and 15 from government, peer-reviewed and published primary sources.
- Every figure shows its sample or source and links to where it came from.
- Aggregates only: no practice is named and no city group under 10 practices is reported.
- Every practice welcome — retainers from $499/mo, Goals-Driven engagements, Performance-Linked Payout Models available.
- Dallas, Texas LLC
- 10-person US client team · Central Time (CST)
- 25+ US healthcare clients
- BAA signed with every client
- HIPAA compliance training across client and delivery teams
- Contracts and invoices in USD
-
 Primary Care · North Dallas, TXCase study →
-
 MedSpa · North Dallas, TX
-
 Skin Care · Beverly Hills, CA
-
 Dental · Christiansburg, VACase study →
-
 Pediatrics · Blacksburg, VACase study →
-
 Pediatric Dentistry · Blacksburg, VACase study →
-
 Dental · Roanoke, VACase study →
-
 Functional Medicine · Telehealth · USACase study →
“They were able to get all my ideas and work with me over a period of three to four months and create this amazing website. It's super customized, very modern, and it incorporates all the elements that I had wanted — the patient portal, nice pictures, a very interactive website, patient reviews. I would highly recommend their company to anyone who wants to make an excellent website.”
The 9 numbers to know first
What these numbers mean for your physical therapy clinic
- A high rating is the baseline, not an edge. Physical therapy clinics have the highest average Google rating of the 9 specialties we studied (4.89 stars). Patients will compare review count, recency and what reviewers say about specific conditions.
- Most clinics sit in the 50–199 review band. 52.2% of clinics are there and only 2.9% have 500 or more, so reaching 200 reviews already puts you in roughly the top 25.8%.
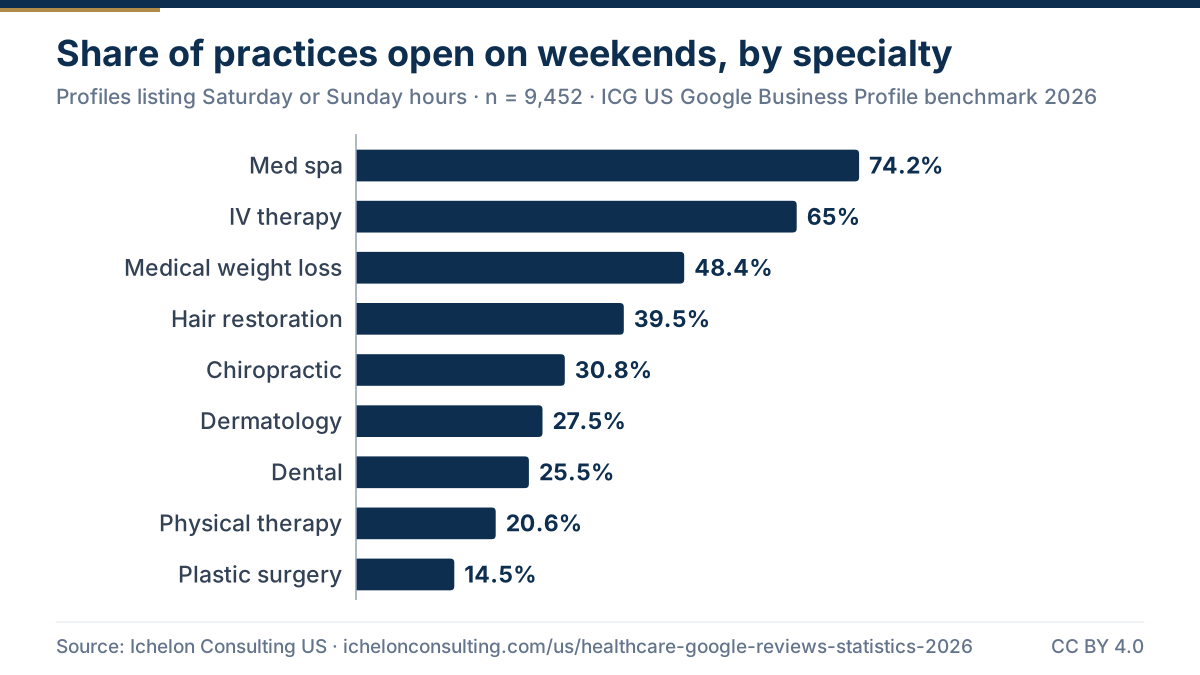
- Weekend and early-morning hours are rare. Only 20.6% of clinics list weekend hours. Working patients search for sessions they can fit around a job; if you offer them, show them on Google and your booking page.
- Lead with direct access. Every state allows some form of direct access to physical therapy. Pages that explain "no referral needed" for your state, along with any limits, answer a question many patients have before they book.
- Older adults are a large, specific audience. More than one in four adults 65 and over falls each year and chronic pain reaches 36.0% in that group. Balance, fall-prevention and post-surgery pages written for them, and for family members who help them book, match real demand.
Google reviews and ratings
How 854 US physical therapy clinics look on Google: star ratings, review depth and how they compare with 8 other specialties.
-
#1
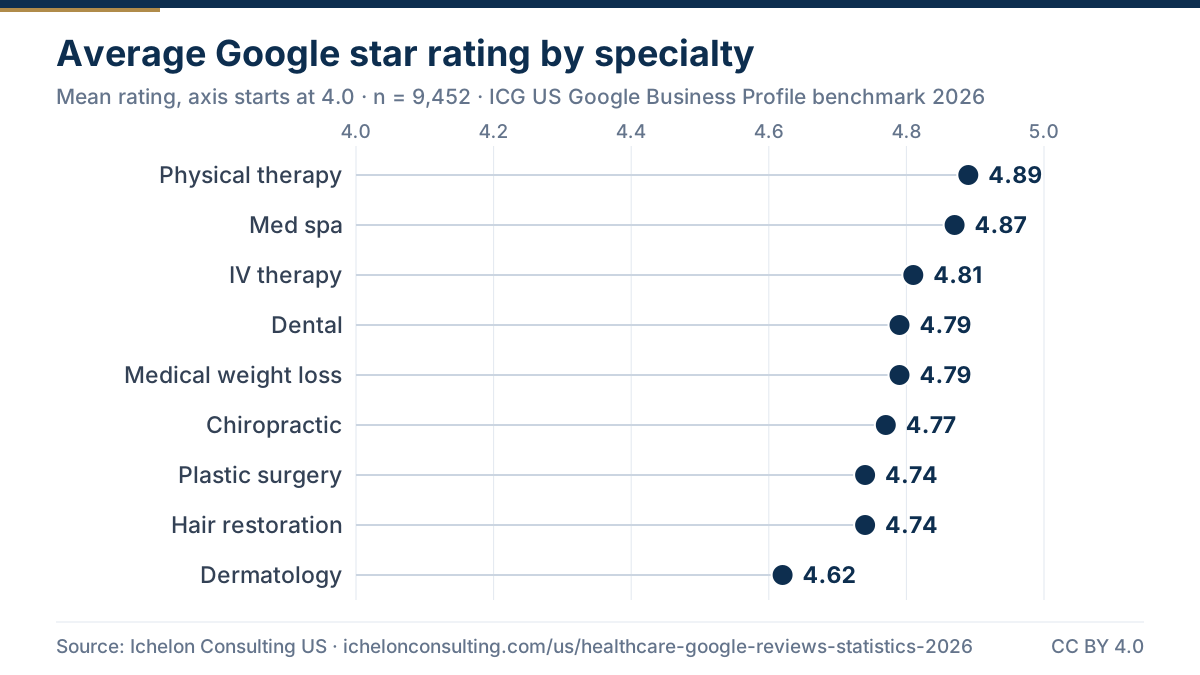
4.89 — The average US physical therapy clinic holds a 4.89-star Google rating.
Sample/method: National figure across 854 US physical therapy clinics in 20 metros; public Google Business Profile data, September 2026. Source: Physical Therapy Google benchmarks 2026 (Ichelon Consulting US) → -
#2
122 — The median US physical therapy clinic has 122 Google reviews.
Sample/method: National figure across 854 US physical therapy clinics in 20 metros; public Google Business Profile data, September 2026. Source: Physical Therapy Google benchmarks 2026 (Ichelon Consulting US) → -
#3
22% — 22% of physical therapy clinics have fewer than 50 Google reviews.
Sample/method: National figure across 854 US physical therapy clinics in 20 metros; public Google Business Profile data, September 2026. Source: Physical Therapy Google benchmarks 2026 (Ichelon Consulting US) → -
#4
52.2% — 52.2% of physical therapy clinics have between 50 and 199 Google reviews.
Sample/method: National figure across 854 US physical therapy clinics in 20 metros; public Google Business Profile data, September 2026. Source: Physical Therapy Google benchmarks 2026 (Ichelon Consulting US) → -
#5
22.8% — 22.8% of physical therapy clinics have between 200 and 499 Google reviews.
Sample/method: National figure across 854 US physical therapy clinics in 20 metros; public Google Business Profile data, September 2026. Source: Physical Therapy Google benchmarks 2026 (Ichelon Consulting US) → -
#6
2.9% — 2.9% of physical therapy clinics have 500 or more Google reviews.
Sample/method: National figure across 854 US physical therapy clinics in 20 metros; public Google Business Profile data, September 2026. Source: Physical Therapy Google benchmarks 2026 (Ichelon Consulting US) → -
#7
74.2% — Combined, 74.2% of physical therapy clinics have fewer than 200 Google reviews, so a profile with 200 or more already sits in the top 25.8% or so.
Sample/method: National figure across 854 US physical therapy clinics in 20 metros; public Google Business Profile data, September 2026. Derived: under-50 share plus 50–199 share. Source: Physical Therapy Google benchmarks 2026 (Ichelon Consulting US) → -
#8
5th of 9 — Physical therapy clinics rank 5th of 9 specialties for review depth; medians run from 33 reviews (hair restoration clinics) to 319.5 (dental practices).
Sample/method: National averages for 9,452 US practices in 9 specialties across 20 metros; public Google Business Profile data, September 2026. Source: Google benchmarks for 9 specialties (Ichelon Consulting US) → -
#9
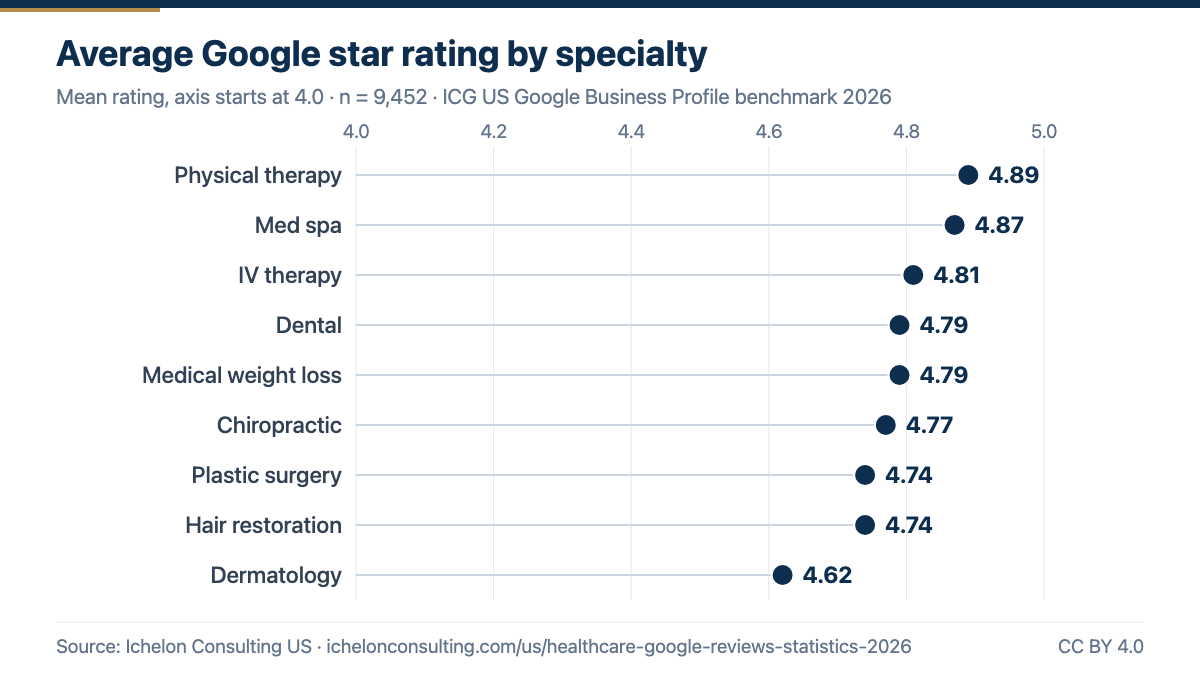
1st of 9 — Physical therapy clinics rank 1st of 9 specialties by average Google rating; averages run from 4.62 stars (dermatology practices) to 4.89 (physical therapy clinics).
Sample/method: National averages for 9,452 US practices in 9 specialties across 20 metros; public Google Business Profile data, September 2026. Source: Google benchmarks for 9 specialties (Ichelon Consulting US) →
Use this chart
Paste this HTML into your article or blog post. Please keep the source link.
Profile completeness and website links
What a patient finds when they open a physical therapy clinic's Google Business Profile: a website link, a phone number and opening hours.
-
#10
98.4% — 98.4% of physical therapy clinics link a website from their Google Business Profile, leaving about 1.6% with no website link.
Sample/method: National figure across 854 US physical therapy clinics in 20 metros; public Google Business Profile data, September 2026. Source: Physical Therapy Google benchmarks 2026 (Ichelon Consulting US) → -
#11
98.7% — 98.7% of physical therapy clinics list a phone number on their Google profile.
Sample/method: National figure across 854 US physical therapy clinics in 20 metros; public Google Business Profile data, September 2026. Source: Physical Therapy Google benchmarks 2026 (Ichelon Consulting US) → -
#12
99.5% — 99.5% of physical therapy clinics publish opening hours on their Google profile.
Sample/method: National figure across 854 US physical therapy clinics in 20 metros; public Google Business Profile data, September 2026. Source: Physical Therapy Google benchmarks 2026 (Ichelon Consulting US) → -
#13
94% — Houston has the lowest share of physical therapy clinics linking a website from Google, at 94%.
Sample/method: Houston: 50 physical therapy clinics. Public Google Business Profile data, September 2026. Cities with fewer than 10 practices in the sample are not reported. Source: Physical Therapy Google benchmarks 2026 (Ichelon Consulting US) →
Opening hours and weekend access
Weekend hours are one of the few things a patient can compare at a glance in Google results. These figures come from the hours listed on each profile.
-
#14
20.6% — 20.6% of physical therapy clinics list hours on at least one weekend day.
Sample/method: National figure across 854 US physical therapy clinics in 20 metros; public Google Business Profile data, September 2026. Based on hours listed on the profile. Source: Physical Therapy Google benchmarks 2026 (Ichelon Consulting US) → -
#15
5.1 — The average physical therapy clinic is open 5.1 days a week.
Sample/method: National figure across 854 US physical therapy clinics in 20 metros; public Google Business Profile data, September 2026. Based on hours listed on the profile. Source: Physical Therapy Google benchmarks 2026 (Ichelon Consulting US) → -
#16
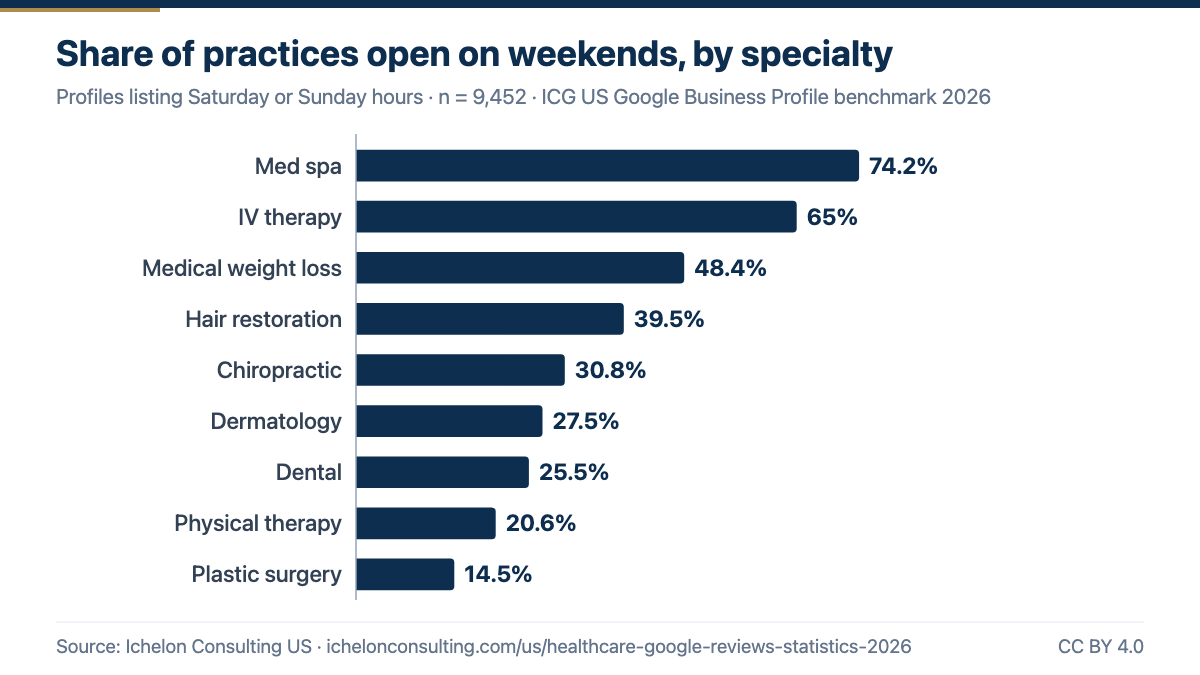
8th of 9 — Physical therapy clinics rank 8th of 9 specialties for weekend opening; the range runs from 14.5% (plastic surgery practices) to 74.2% (med spas).
Sample/method: National averages for 9,452 US practices in 9 specialties across 20 metros; public Google Business Profile data, September 2026. Based on hours listed on the profile. Source: Google benchmarks for 9 specialties (Ichelon Consulting US) → -
#17
45.6% — 45.6% of physical therapy clinics in New York open on a weekend day, the highest of the 20 metros studied.
Sample/method: New York: 57 physical therapy clinics. Public Google Business Profile data, September 2026. Cities with fewer than 10 practices in the sample are not reported. Source: Physical Therapy Google benchmarks 2026 (Ichelon Consulting US) → -
#18
6.3% — In Scottsdale, only 6.3% of physical therapy clinics open on a weekend day, the lowest of the metros studied.
Sample/method: Scottsdale: 48 physical therapy clinics. Public Google Business Profile data, September 2026. Cities with fewer than 10 practices in the sample are not reported. Source: Physical Therapy Google benchmarks 2026 (Ichelon Consulting US) → -
#19
0 of 20 — In none of the 20 metros do more than half of physical therapy clinics open on at least one weekend day.
Sample/method: City figures, 20 metros with 10 or more physical therapy clinics each. Public Google Business Profile data, September 2026. Source: Physical Therapy Google benchmarks 2026 (Ichelon Consulting US) →
Use this chart
Paste this HTML into your article or blog post. Please keep the source link.
City benchmarks across 20 US metros
Local search is decided city by city. These figures compare physical therapy clinics across the 20 metros in our sample (every city shown has at least 10 physical therapy clinics).
-
#20
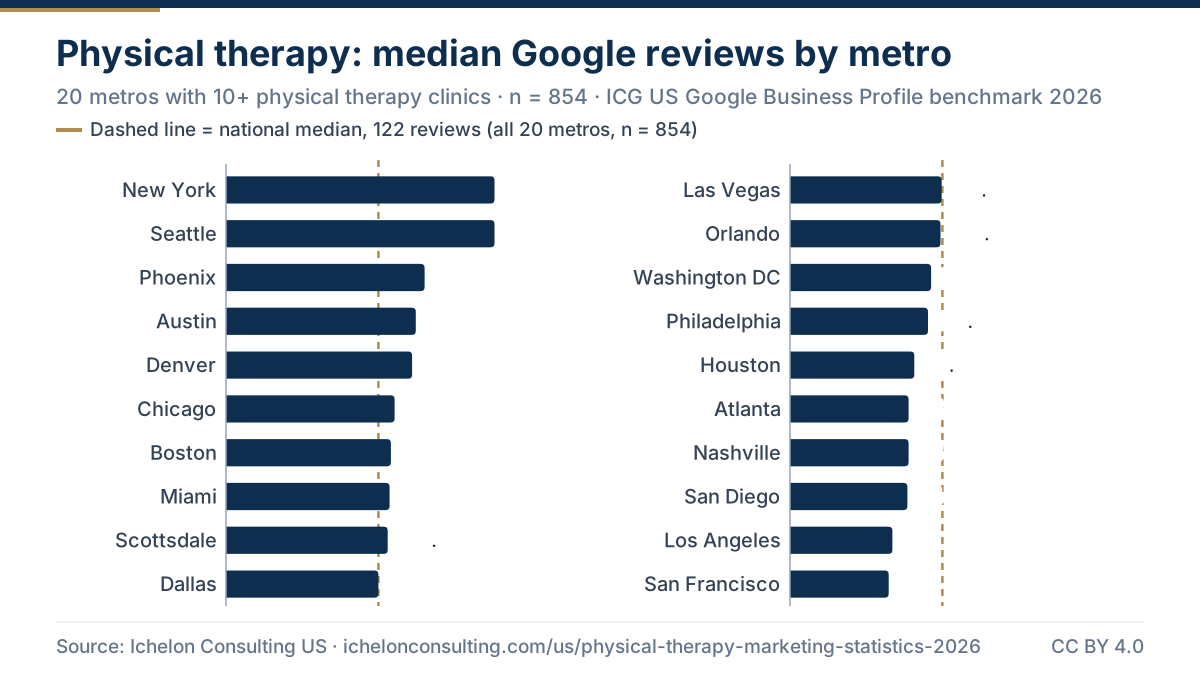
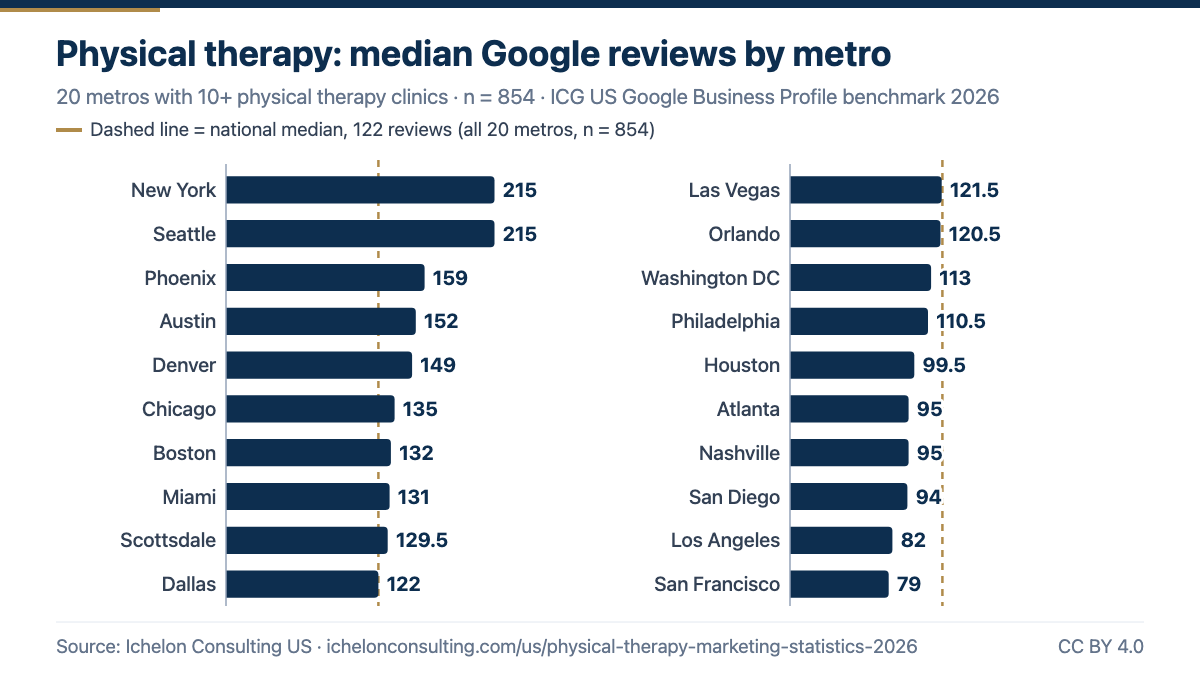
215 — New York and Seattle physical therapy clinics have the deepest review profiles of any metro studied, with a median of 215 Google reviews.
Sample/method: New York: 57 physical therapy clinics; Seattle: 35 physical therapy clinics. Public Google Business Profile data, September 2026. Cities with fewer than 10 practices in the sample are not reported. Source: Physical Therapy Google benchmarks 2026 (Ichelon Consulting US) → -
#21
79 — San Francisco has the thinnest review profiles for physical therapy clinics, with a median of 79 Google reviews.
Sample/method: San Francisco: 34 physical therapy clinics. Public Google Business Profile data, September 2026. Cities with fewer than 10 practices in the sample are not reported. Source: Physical Therapy Google benchmarks 2026 (Ichelon Consulting US) → -
#22
2.7× — The median review count in the deepest metro is 2.7 times the count in the thinnest, so the number of reviews that looks "normal" depends heavily on the city.
Sample/method: Derived from the two city medians above. Source: Physical Therapy Google benchmarks 2026 (Ichelon Consulting US) → -
#23
9 of 20 — In 9 of 20 metros, the median physical therapy clinic has more Google reviews than the national median of 122.
Sample/method: City medians compared with the national median. Public Google Business Profile data, September 2026. Source: Physical Therapy Google benchmarks 2026 (Ichelon Consulting US) → -
#24
0 of 20 — In none of the 20 metros does the median physical therapy clinic have fewer than 50 Google reviews.
Sample/method: City medians, 20 metros. Public Google Business Profile data, September 2026. Source: Physical Therapy Google benchmarks 2026 (Ichelon Consulting US) → -
#25
4.97 — Chicago physical therapy clinics have the highest average Google rating of the metros studied, at 4.97 stars.
Sample/method: Chicago: 49 physical therapy clinics. Public Google Business Profile data, September 2026. Cities with fewer than 10 practices in the sample are not reported. Source: Physical Therapy Google benchmarks 2026 (Ichelon Consulting US) → -
#26
4.83 — Nashville physical therapy clinics have the lowest average Google rating of the metros studied, at 4.83 stars.
Sample/method: Nashville: 30 physical therapy clinics. Public Google Business Profile data, September 2026. Cities with fewer than 10 practices in the sample are not reported. Source: Physical Therapy Google benchmarks 2026 (Ichelon Consulting US) → -
#27
15.8% — 15.8% of physical therapy clinics in New York have 500 or more Google reviews, the highest share of any metro studied.
Sample/method: New York: 57 physical therapy clinics. Public Google Business Profile data, September 2026. Cities with fewer than 10 practices in the sample are not reported. Source: Physical Therapy Google benchmarks 2026 (Ichelon Consulting US) → -
#28
41.3% — 41.3% of physical therapy clinics in Los Angeles have fewer than 50 Google reviews, the highest share of any metro studied.
Sample/method: Los Angeles: 46 physical therapy clinics. Public Google Business Profile data, September 2026. Cities with fewer than 10 practices in the sample are not reported. Source: Physical Therapy Google benchmarks 2026 (Ichelon Consulting US) → -
#29
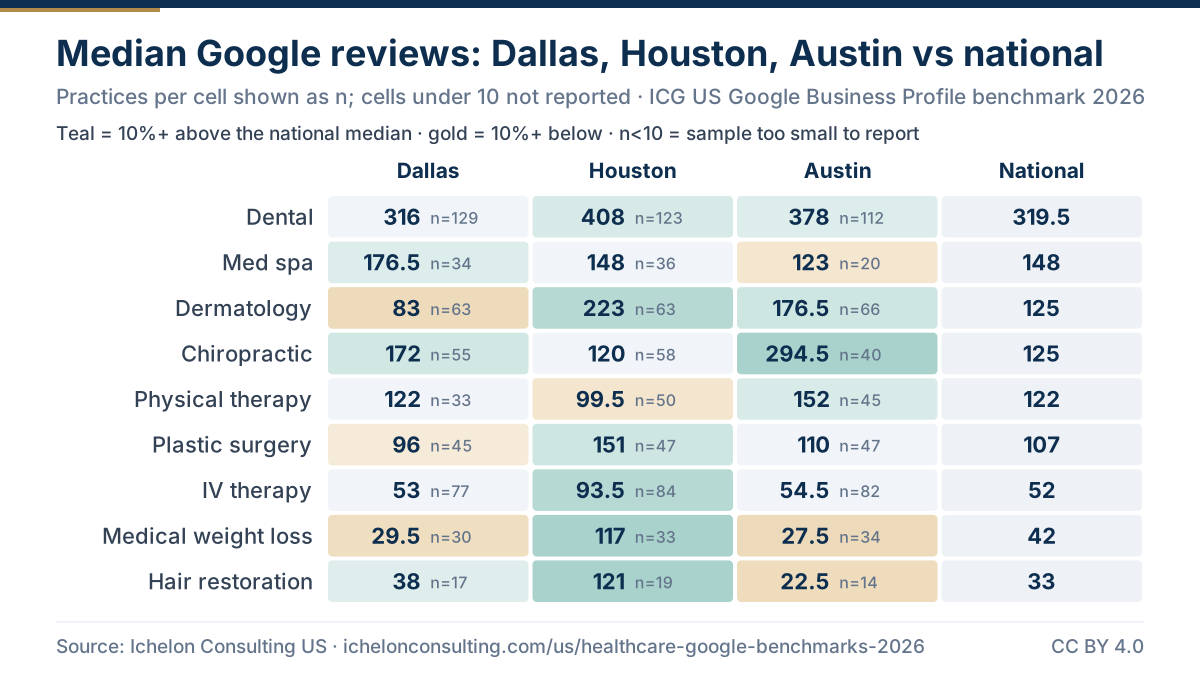
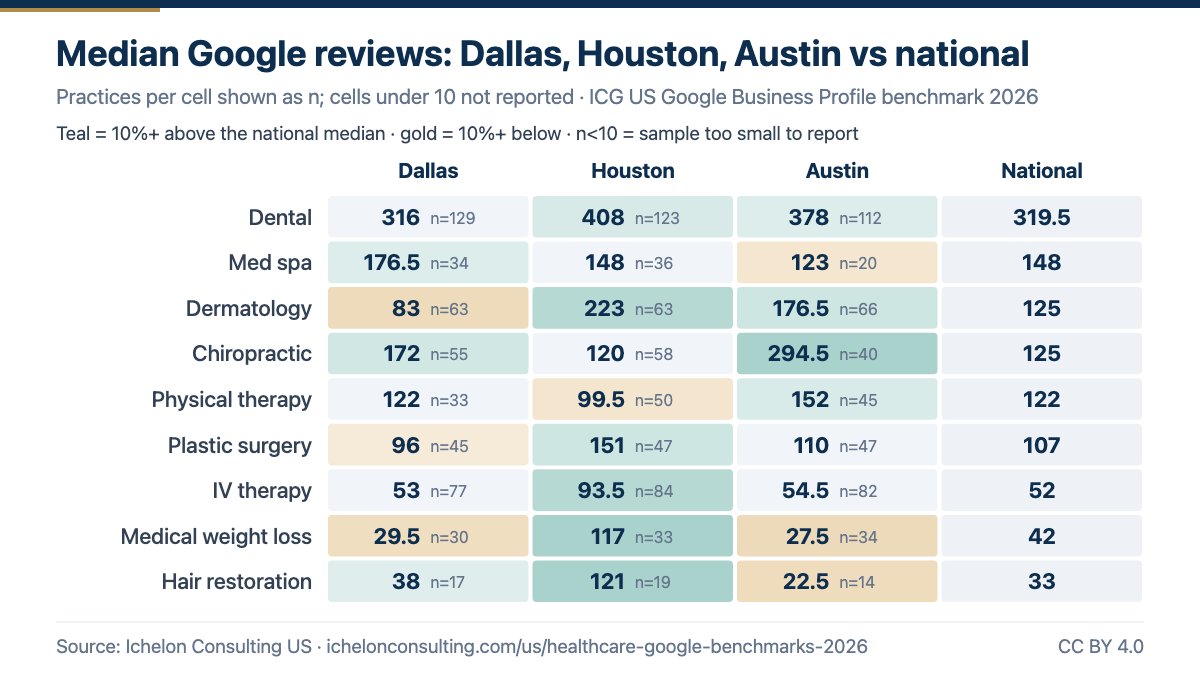
152 — In Texas, the median physical therapy clinic has 152 Google reviews in Austin, 122 in Dallas and 99.5 in Houston.
Sample/method: Austin: 45 physical therapy clinics; Dallas: 33 physical therapy clinics; Houston: 50 physical therapy clinics. Public Google Business Profile data, September 2026. Source: Physical Therapy Google benchmarks 2026 (Ichelon Consulting US) →
Use this chart
Paste this HTML into your article or blog post. Please keep the source link.
Use this chart
Paste this HTML into your article or blog post. Please keep the source link.
The patient need behind physical therapy searches
Federal data on chronic pain and falls, two of the conditions that bring adults to a physical therapist.
-
#30
24.3% — In 2023, 24.3% of US adults had chronic pain, and 8.5% had high-impact chronic pain that frequently limited life or work activities.
Source detail: NCHS Data Brief No. 518, National Health Interview Survey 2023. Chronic pain = pain on most days or every day in the past 3 months. Source: CDC NCHS Data Brief No. 518: Chronic Pain and High-impact Chronic Pain in U.S. Adults, 2023 → -
#31
36.0% — Chronic pain rises with age, from 12.3% of adults aged 18–29 to 36.0% of adults 65 and older; high-impact chronic pain rises from 3.0% to 13.5% (2023).
Source detail: NCHS Data Brief No. 518, National Health Interview Survey 2023. Source: CDC NCHS Data Brief No. 518: Chronic Pain and High-impact Chronic Pain in U.S. Adults, 2023 → -
#32
31.4% — Chronic pain is more common outside big cities: 31.4% of adults in nonmetropolitan areas had it in 2023, against 20.5% in large central metro areas.
Source detail: NCHS Data Brief No. 518, National Health Interview Survey 2023. Source: CDC NCHS Data Brief No. 518: Chronic Pain and High-impact Chronic Pain in U.S. Adults, 2023 → -
#33
1 in 4+ — More than one in four older adults (65 and over) falls each year.
Source detail: CDC, Older Adult Falls: Facts and Stats. Source: CDC, Older Adult Falls: Facts and Stats → -
#34
4.5 million — Falls among older adults lead to about 4.5 million emergency department visits a year, including 1.4 million hospitalizations.
Source detail: CDC, Older Adult Falls: Facts and Stats. Source: CDC, Older Adult Falls: Facts and Stats → -
#35
319,000 — Nearly 319,000 older adults are hospitalized for hip fractures each year, and falls cause 88% of emergency visits and hospitalizations for hip fractures.
Source detail: CDC, Older Adult Falls: Facts and Stats. Source: CDC, Older Adult Falls: Facts and Stats →
Direct access and Medicare thresholds
Two rules that shape how a physical therapy clinic can market itself: whether patients can book without a referral, and how Medicare reviews therapy spending.
-
#36
50 + DC — All 50 states, the District of Columbia and the US Virgin Islands allow patients either provisional or unrestricted direct access to physical therapist services, without a physician referral (as of July 1, 2025).
Source detail: American Physical Therapy Association. Provisional access can carry time, visit or procedure limits that vary by state. Source: American Physical Therapy Association, Direct Access Advocacy → -
#37
$2,480 — For 2026, the Medicare KX modifier threshold is $2,480 for physical therapy and speech-language pathology services combined; claims above it need the KX modifier confirming medical necessity.
Source detail: CMS, Therapy Services, CY 2026 update. Source: CMS, Therapy Services (CY 2026 KX modifier and medical review thresholds) → -
#38
$3,000 — The Medicare targeted medical review threshold for physical therapy and speech-language pathology services is $3,000.
Source detail: CMS, Therapy Services, CY 2026 update. Source: CMS, Therapy Services (CY 2026 KX modifier and medical review thresholds) →
How big the physical therapy profession is
Federal labor data for physical therapists.
-
#39
283,700 — Physical therapists held 283,700 jobs in the US in 2025.
Source detail: U.S. Bureau of Labor Statistics, Occupational Outlook Handbook. Source: U.S. Bureau of Labor Statistics, Occupational Outlook Handbook: Physical Therapists → -
#40
12% — Employment of physical therapists is projected to grow 12% from 2025 to 2035, about 33,800 more jobs, which BLS rates as much faster than the average for all occupations.
Source detail: BLS Occupational Outlook Handbook, 2025–35 projections. Source: U.S. Bureau of Labor Statistics, Occupational Outlook Handbook: Physical Therapists → -
#41
13,400 — About 13,400 openings for physical therapists are projected each year, on average, over the decade to 2035.
Source detail: BLS Occupational Outlook Handbook, 2025–35 projections. Source: U.S. Bureau of Labor Statistics, Occupational Outlook Handbook: Physical Therapists → -
#42
36% — 36% of physical therapists work in offices of physical, occupational and speech therapists and audiologists, the largest single setting.
Source detail: BLS Occupational Outlook Handbook, largest employers of physical therapists. Source: U.S. Bureau of Labor Statistics, Occupational Outlook Handbook: Physical Therapists → -
#43
26% + 11% — 26% of physical therapists work in hospitals and 11% in home healthcare services, the main settings outpatient clinics compete with.
Source detail: BLS Occupational Outlook Handbook, largest employers of physical therapists. Source: U.S. Bureau of Labor Statistics, Occupational Outlook Handbook: Physical Therapists → -
#44
4% — Only 4% of physical therapists are self-employed, against 6% in nursing and residential care facilities.
Source detail: BLS Occupational Outlook Handbook, largest employers of physical therapists. Source: U.S. Bureau of Labor Statistics, Occupational Outlook Handbook: Physical Therapists →
How physical therapy clinics compare with 8 other specialties
National averages from the same September 2026 Google study (9,452 US practices, 20 metros). The highlighted row is this page's specialty.
| Specialty | Practices | Avg rating | Median reviews | Under 50 reviews | Website linked | Open weekends |
|---|---|---|---|---|---|---|
| Dental | 2,318 | 4.79 | 319.5 | 9.1% | 97.2% | 25.5% |
| Med Spa | 555 | 4.87 | 148 | 15.9% | 98.4% | 74.2% |
| Dermatology | 1,330 | 4.62 | 125 | 31.1% | 95.4% | 27.5% |
| Chiropractic | 1,035 | 4.77 | 125 | 27% | 95% | 30.8% |
| Physical Therapy | 854 | 4.89 | 122 | 22% | 98.4% | 20.6% |
| Cosmetic & Plastic Surgery | 874 | 4.74 | 107 | 29.9% | 97.6% | 14.5% |
| IV Therapy & Wellness | 1,535 | 4.81 | 52 | 48.4% | 94.1% | 65% |
| Medical Weight Loss | 632 | 4.79 | 42 | 53.8% | 96.8% | 48.4% |
| Hair Restoration | 319 | 4.74 | 33 | 58.3% | 95% | 39.5% |
Full city tables: Physical Therapy Google benchmarks for 20 US cities · all 9 specialties.
See where your physical therapy clinic sits against these numbers
Our US team checks your Google profile, reviews and website against the physical therapy figures for your city and sends back a short, plain-English list of fixes. No cost and no obligation.
Get the full Physical Therapy dataset + PDF summary
The numbers behind this page, ready for your own spreadsheet or slide deck.
- CSV, 21 rows: national figures plus every metro with at least 10 physical therapy clinics.
- Fields: average Google rating, median review count, review-count bands, website, phone and hours listed, weekend opening, days open per week.
- PDF summary with the tables, methodology and a citation line.
Public Google Business Profile data for 854 US physical therapy clinics, September 2026. Aggregates only. Free to reuse under CC BY 4.0.
Where the numbers come from
- Our Google study (29 statistics). Public Google Business Profile data for 854 US physical therapy clinics across 20 metros, collected in September 2026, part of a 9,452-practice study of 9 specialties. Ratings are simple averages; review counts are medians; shares are percentages of practices in the sample. Weekend and days-open figures come from the hours listed on each profile.
- Publishing rules. Aggregates only. No practice is named, no review text is quoted, and no city with fewer than 10 practices in the sample is reported. Derived figures (sums, ratios, ranks) are calculated from the published averages and say so in the method line.
- External statistics (15). Quoted from the primary source linked under each figure (federal agencies, professional bodies, peer-reviewed journals and surveys that publish their method). Each keeps its own year; we did not adjust or project them.
- What we do not publish here. US advertising costs (cost per click or per lead) and patient fees. We only publish figures we can source, and we do not have a verified public US dataset for physical therapy ad costs.
How to cite this page:
Embed our charts: every chart on this page has a “Use this chart” box with copy-ready HTML. The code shows the image and links back to this page as the source. PNG and SVG files are free to reuse under CC BY 4.0 with that credit link.
To cite one figure, link its anchor (for example https://ichelonconsulting.com/us/physical-therapy-marketing-statistics-2026#stat-1). For external figures, please cite the original source listed below. Our own aggregates may be reused under CC BY 4.0 with attribution.
Sources
- Physical Therapy Google benchmarks 2026 (Ichelon Consulting US) — https://ichelonconsulting.com/us/physical-therapy-google-benchmarks-2026
- Google benchmarks for 9 specialties (Ichelon Consulting US) — https://ichelonconsulting.com/us/healthcare-google-benchmarks-2026
- CDC NCHS Data Brief No. 518: Chronic Pain and High-impact Chronic Pain in U.S. Adults, 2023 — https://www.cdc.gov/nchs/products/databriefs/db518.htm
- CDC, Older Adult Falls: Facts and Stats — https://www.cdc.gov/falls/data-research/facts-stats/index.html
- American Physical Therapy Association, Direct Access Advocacy — https://www.apta.org/advocacy/issues/direct-access-advocacy
- CMS, Therapy Services (CY 2026 KX modifier and medical review thresholds) — https://www.cms.gov/medicare/coding-billing/therapy-services
- U.S. Bureau of Labor Statistics, Occupational Outlook Handbook: Physical Therapists — https://www.bls.gov/ooh/healthcare/physical-therapists.htm
Related pages from the US team
Physical therapy practice marketing guide
Direct access, reviews and referral marketing for US PT clinics.
Physical therapy Google benchmarks 2026
Ratings, reviews and weekend hours city by city.
Chiropractic marketing statistics
The closest neighboring specialty, side by side.
Healthcare Google reviews statistics
Review and rating data across 9 specialties.
Every practice welcome — Goals-Driven engagements from $499/mo
We benchmark your last 90 days, agree monthly goals with you, and track them live on Ichelon Agency OS with a report every Monday. Performance-Linked Payout Models are available. Our US leadership is based in Dallas, and strategy calls run in US business hours.
Common questions
How many Google reviews does a physical therapy clinic need?
The median US physical therapy clinic has 122 Google reviews; 22% have fewer than 50 and 2.9% have 500 or more. City medians run from 79 in San Francisco to 215 in New York and Seattle (854 clinics, 20 metros, September 2026).
What is the average Google rating for a physical therapy clinic?
4.89 stars, the highest average of the 9 specialties in our September 2026 study. Chicago clinics average 4.97 stars, the highest of any metro.
Can patients see a physical therapist without a referral?
Yes, in some form in every state. As of July 1, 2025, all 50 states, the District of Columbia and the US Virgin Islands allow provisional or unrestricted direct access to physical therapist services, according to the APTA. States with provisional access attach limits, such as time or visit caps.
How many physical therapists are there in the US?
Physical therapists held 283,700 jobs in 2025, according to the Bureau of Labor Statistics, which projects 12% employment growth from 2025 to 2035 and about 13,400 openings a year.
What is the Medicare therapy threshold for 2026?
For 2026, the KX modifier threshold is $2,480 for physical therapy and speech-language pathology services combined, and the targeted medical review threshold is $3,000 (CMS).
Are physical therapy clinics open on weekends?
Only 20.6% of US physical therapy clinics list weekend hours, and the average clinic is open 5.1 days a week. New York has the highest weekend share (45.6%).
A note on this guide: it explains marketing practice, not legal advice. Rules on privacy, advertising and insurance change and vary by state, so confirm anything compliance-related with your own counsel.
Want your physical therapy clinic benchmarked against these numbers?
A free 30-minute call with the US team. We compare your Google profile with your specialty and city figures and tell you what we would fix first.