Dental Marketing Statistics 2026
US dental practices in 2026: the average practice holds a 4.79-star Google rating with a median of 319.5 reviews, the most of any specialty we track; the median practice adds 5.17 reviews a month; only 25.5% list weekend hours; and 66.7% of US adults had a dental exam or cleaning in the past year (CDC).

- 48 statistics in one place: our September 2026 Google data on 2,318 US dental practices plus 4 verified outside sources.
- Each figure shows its sample or source and links to the page it came from, so you can check it before you quote it.
- Our data is aggregate only: no practice is named and no metro with fewer than 10 dental practices is reported.
- Every practice welcome — retainers from $499/mo, Goals-Driven engagements, Performance-Linked Payout Models available.
- Dallas, Texas LLC
- 10-person US client team · Central Time (CST)
- 25+ US healthcare clients
- BAA signed with every client
- HIPAA compliance training across client and delivery teams
- Contracts and invoices in USD
-
 Primary Care · North Dallas, TXCase study →
-
 MedSpa · North Dallas, TX
-
 Skin Care · Beverly Hills, CA
-
 Dental · Christiansburg, VACase study →
-
 Pediatrics · Blacksburg, VACase study →
-
 Pediatric Dentistry · Blacksburg, VACase study →
-
 Dental · Roanoke, VACase study →
-
 Functional Medicine · Telehealth · USACase study →
“They were able to get all my ideas and work with me over a period of three to four months and create this amazing website. It's super customized, very modern, and it incorporates all the elements that I had wanted — the patient portal, nice pictures, a very interactive website, patient reviews. I would highly recommend their company to anyone who wants to make an excellent website.”
The 8 numbers to know first
This page brings together every citable number we have on how US dental practices compete for patients: our own dental Google benchmarks and dental Google presence study, plus workforce, visit and spending figures from the ADA, CDC and CMS. For what patients expect and where practices fall short, see the free dental patient experience report.
Google ratings and review depth
How 2,318 US dental practices look on Google: star ratings, review counts and how they compare with 8 other specialties.
-
#1
4.79 — The average US dental practice holds a 4.79-star Google rating.
Sample/method: Public Google Business Profile data for 2,318 US dental practices across 20 metros, collected September 2026. Source: Dental Google benchmarks 2026 → -
#2
319.5 — The median US dental practice has 319.5 Google reviews.
Sample/method: Public Google Business Profile data for 2,318 US dental practices across 20 metros, collected September 2026. Source: Dental Google benchmarks 2026 → -
#3
9.1% — 9.1% of US dental practices have fewer than 50 Google reviews.
Sample/method: Public Google Business Profile data for 2,318 US dental practices across 20 metros, collected September 2026. Source: Dental Google benchmarks 2026 → -
#4
22.4% — 22.4% of dental practices have 50 to 199 Google reviews, and 37.5% have 200 to 499.
Sample/method: Public Google Business Profile data for 2,318 US dental practices across 20 metros, collected September 2026. Source: Dental Google benchmarks 2026 → -
#5
30.9% — 30.9% of US dental practices have 500 or more Google reviews.
Sample/method: Public Google Business Profile data for 2,318 US dental practices across 20 metros, collected September 2026. Source: Dental Google benchmarks 2026 → -
#6
1st — Dental practices rank 1st of 9 healthcare specialties we benchmarked for median Google review count (319.5); the next deepest, med spas, have a median of 148.
Sample/method: National medians across 9,452 US practices in 9 specialties and 20 metros, public Google Business Profile data, September 2026. Source: Healthcare Google benchmarks 2026 (9 specialties) → -
#7
4th — Dental practices are tied for 4th of 9 specialties for average Google rating (4.79 stars); the highest average is 4.89 stars, for physical therapy clinics.
Sample/method: National averages across 9,452 US practices in 9 specialties and 20 metros, September 2026. Source: Healthcare Google benchmarks 2026 (9 specialties) →
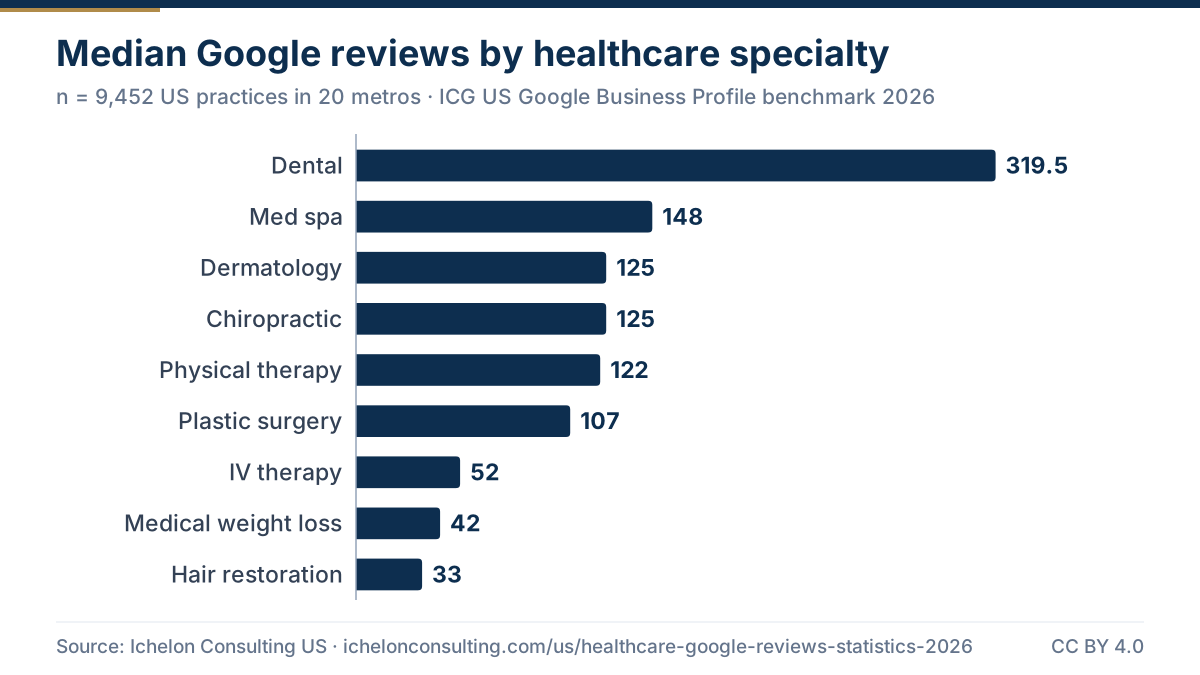
Use this chart
Paste this HTML into your article or blog post. Please keep the source link.
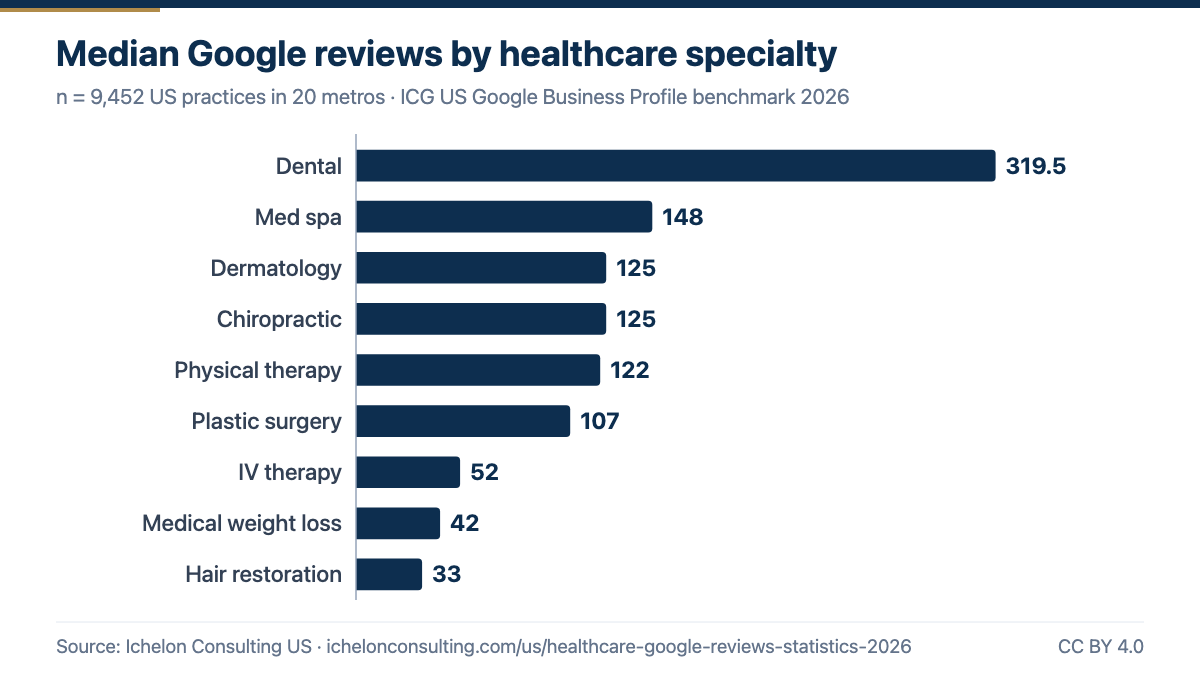
Use this chart
Paste this HTML into your article or blog post. Please keep the source link.
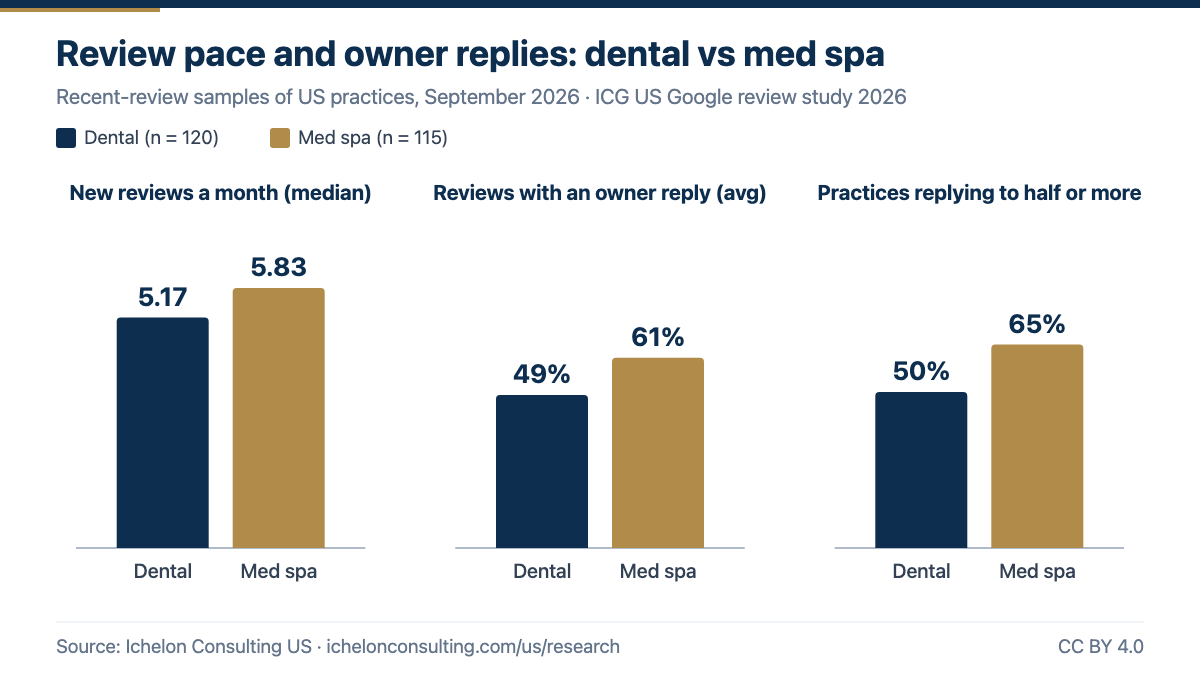
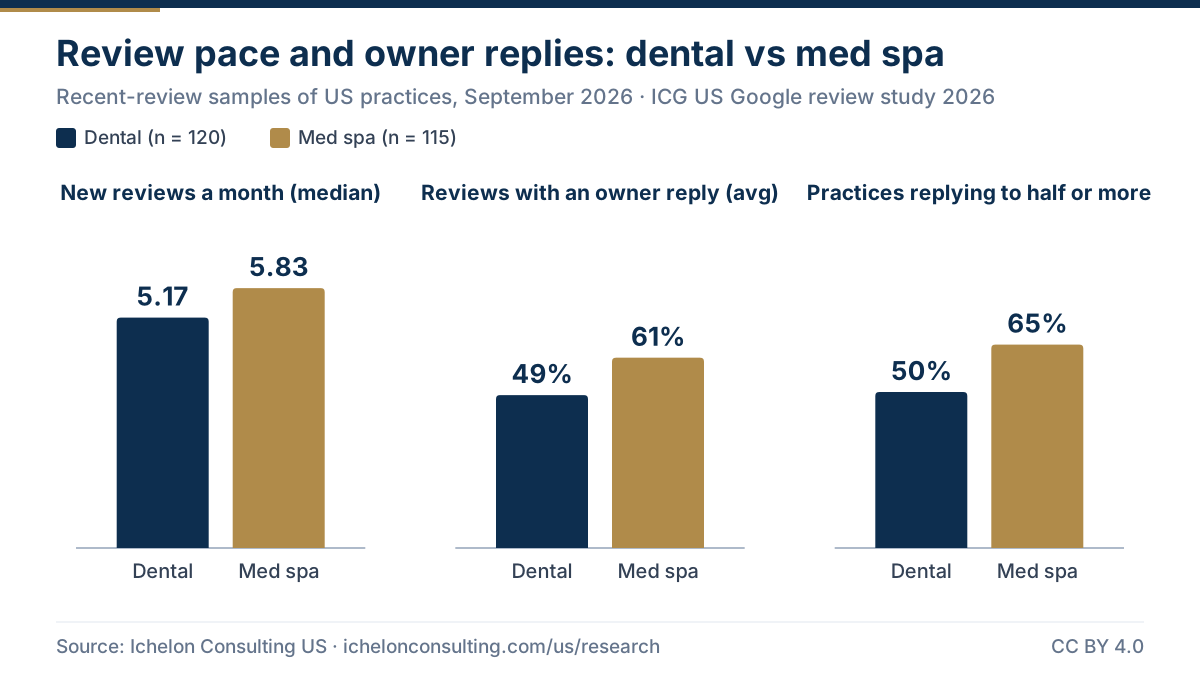
How fast reviews arrive and how often owners reply
From a 120-practice review sample. These figures are reported nationally only.
-
#8
5.17 — The median US dental practice gets 5.17 new Google reviews a month.
Sample/method: Up to 50 recent Google reviews per practice in a 120-practice subsample of the 2,318-practice study, September 2026. National figure only. Source: How many new reviews a month is normal for a dentist? → -
#9
49% — Dental practice owners reply to 49% of their Google reviews on average.
Sample/method: Up to 50 recent Google reviews per practice in a 120-practice subsample of the 2,318-practice study, September 2026. National figure only. Reply rate = share of sampled reviews with an owner reply. Source: Should dentists reply to Google reviews? → -
#10
50% — 50% of dental practices reply to at least half of their Google reviews.
Sample/method: Up to 50 recent Google reviews per practice in a 120-practice subsample of the 2,318-practice study, September 2026. National figure only. Source: Should dentists reply to Google reviews? →
What published research says about dental reviews
A peer-reviewed look at online reviews in one dental specialty. Older and narrower than our data, but useful context.
-
#11
92.4% — In a study of 807 North American orthodontists, 92.4% had online reviews on at least one of two major review sites.
Source detail: Random sample of 10.6% of American Association of Orthodontists members; Google and one other review site. Published 2020. Source: Skrypczak et al., American Journal of Orthodontics and Dentofacial Orthopedics (2020) → -
#12
4.72 — The same study found an average Google rating of 4.72 stars for orthodontists.
Source detail: Orthodontists with Google reviews in the 807-orthodontist sample. Published 2020. Source: Skrypczak et al., American Journal of Orthodontics and Dentofacial Orthopedics (2020) → -
#13
50.9% — About half of those orthodontists (50.9%) had at least one negative (1- or 2-star) review, and those who posted replies to negative reviews had significantly better average ratings.
Source detail: The authors note the reply-rating link is an association, not proof of cause. Published 2020. Source: Skrypczak et al., American Journal of Orthodontics and Dentofacial Orthopedics (2020) →
Profile completeness, hours and weekend access
The listing details that turn a Google search into a call or a booking: website link, phone number, published hours and weekend opening.
-
#14
97.2% — 97.2% of US dental practice Google profiles link to a website.
Sample/method: Public Google Business Profile data for 2,318 US dental practices across 20 metros, collected September 2026. Source: Dental Google benchmarks 2026 → -
#15
99.6% — 99.6% of dental practice profiles list a phone number.
Sample/method: Public Google Business Profile data for 2,318 US dental practices across 20 metros, collected September 2026. Source: Dental Google benchmarks 2026 → -
#16
98.4% — 98.4% of dental practice profiles publish opening hours.
Sample/method: Public Google Business Profile data for 2,318 US dental practices across 20 metros, collected September 2026. Source: Dental Google benchmarks 2026 → -
#17
25.5% — 25.5% of US dental practices list hours on at least one weekend day.
Sample/method: Public Google Business Profile data for 2,318 US dental practices across 20 metros, collected September 2026. Based on hours listed on the profile. Source: Dental Google benchmarks 2026 → -
#18
4.8 — The average dental practice is open 4.8 days a week, based on listed hours.
Sample/method: Public Google Business Profile data for 2,318 US dental practices across 20 metros, collected September 2026. Source: Dental Google benchmarks 2026 → -
#19
7th — Dental practices rank 7th of 9 specialties for weekend opening; med spas are most likely to open on weekends (74.2%).
Sample/method: National shares across 9,452 US practices in 9 specialties, September 2026. Based on hours listed on the profile. Source: Healthcare Google benchmarks 2026 (9 specialties) → -
#20
71.9% — 71.9% of dental practice profiles list at least one secondary Google category beyond their main one.
Sample/method: Public Google Business Profile data for 2,318 US dental practices across 20 metros, collected September 2026. Source: What patients see on a dental Google profile →
How often patients visit, and what they write about
Visit rates from federal survey data, then the topics and sentiment in dental Google reviews. Small theme counts are signals, not verdicts.
-
#21
66.7% — 66.7% of US adults age 18 and older had a dental exam or cleaning in the past year.
Source detail: CDC FastStats, citing the Early Release of Selected Estimates from the 2025 National Health Interview Survey. Source: CDC, National Center for Health Statistics: FastStats, Oral and Dental Health → -
#22
86.9% — 86.9% of US children ages 2 to 17 had a dental visit in the past year (2019).
Source detail: CDC FastStats, citing Health, United States, 2019. Source: CDC, National Center for Health Statistics: FastStats, Oral and Dental Health → -
#23
61% — Staff and bedside manner makes up 61% of theme mentions in dental Google reviews, and 97.5% of those mentions are positive.
Sample/method: 2,992 theme mentions classified by topic and sentiment from Google reviews of a 120-practice subsample, September 2026. Directional. 1,829 mentions. Source: Top 5 things dental patients value → -
#24
96.8% — 96.8% of pain and comfort mentions in dental reviews are positive.
Sample/method: 2,992 theme mentions classified by topic and sentiment from Google reviews of a 120-practice subsample, September 2026. Directional. 250 mentions. Source: Top 5 things dental patients value → -
#25
73.9% — Upselling is the most negative theme in dental reviews: 73.9% of mentions are negative.
Sample/method: 2,992 theme mentions classified by topic and sentiment from Google reviews of a 120-practice subsample, September 2026. Directional. 46 mentions. Source: The upselling mismatch in dental reviews → -
#26
42.5% — 42.5% of price and value mentions in dental reviews are negative.
Sample/method: 2,992 theme mentions classified by topic and sentiment from Google reviews of a 120-practice subsample, September 2026. Directional. 113 mentions. Source: Price, booking and wait times in dental reviews → -
#27
40% — 40% of booking and communication mentions in dental reviews are negative.
Sample/method: 2,992 theme mentions classified by topic and sentiment from Google reviews of a 120-practice subsample, September 2026. Directional. 100 mentions. Source: Price, booking and wait times in dental reviews → -
#28
17.1% — 17.1% of wait-time and scheduling mentions in dental reviews are negative.
Sample/method: 2,992 theme mentions classified by topic and sentiment from Google reviews of a 120-practice subsample, September 2026. Directional. 158 mentions. Source: Price, booking and wait times in dental reviews →
How the 20 metros compare
Metro figures for dental practices, ranked. Only metros with at least 10 dental practices in the sample are reported.
-
#29
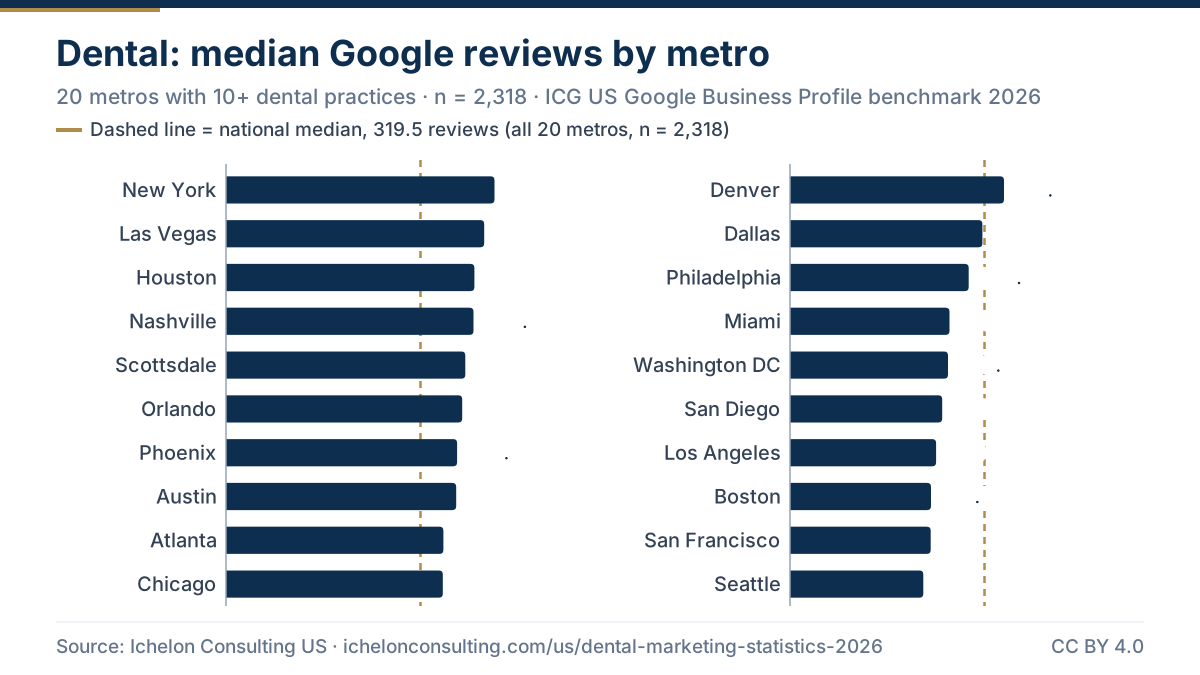
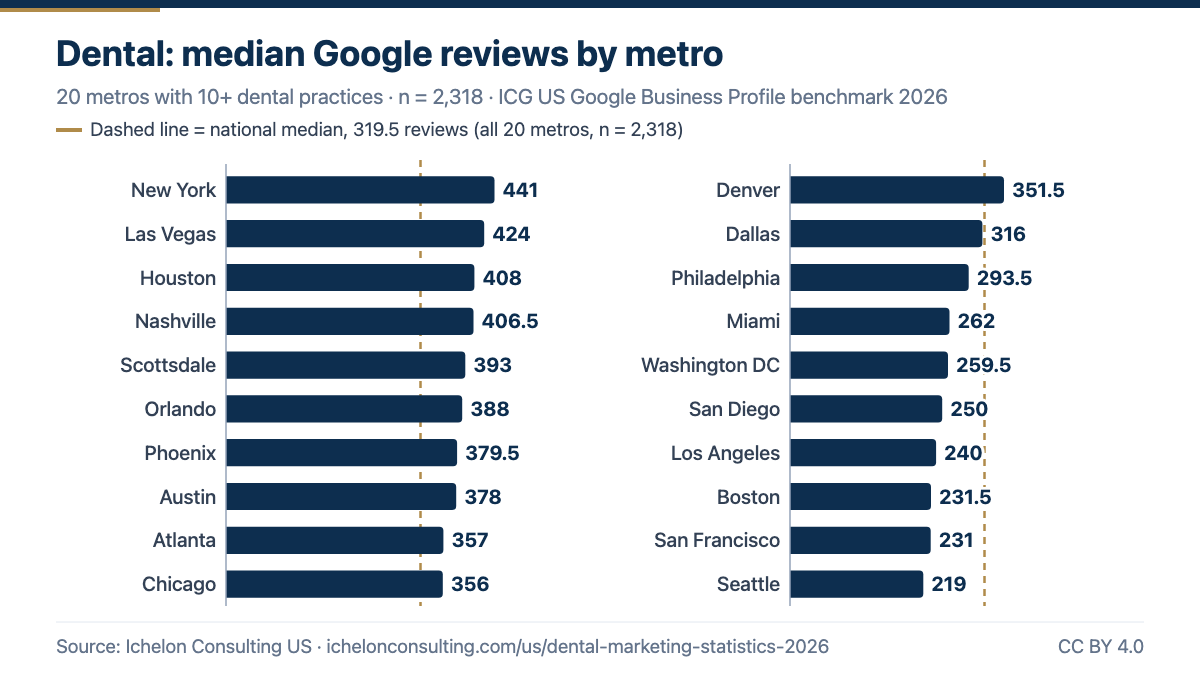
441 — New York has the deepest review profiles of the 20 metros studied: the median dental practice there has 441 Google reviews.
Sample/method: New York: 127 dental practices in the sample. Public Google Business Profile data, September 2026. Metros with fewer than 10 dental practices are not reported. Source: Dental Google benchmarks 2026 → -
#30
219 — Seattle has the thinnest, at a median of 219 reviews; the top metro's median is 2 times as high.
Sample/method: Seattle: 117 dental practices in the sample. Public Google Business Profile data, September 2026. Metros with fewer than 10 dental practices are not reported. Source: Dental Google benchmarks 2026 → -
#31
11 of 20 — In 11 of the 20 metros studied, the median dental practice has more Google reviews than the national median of 319.5.
Sample/method: Public Google Business Profile data for 2,318 US dental practices across 20 metros, collected September 2026. Source: Dental Google benchmarks 2026 → -
#32
4.86 — Scottsdale has the highest average Google rating for dental practices among the metros studied, at 4.86 stars.
Sample/method: Scottsdale: 103 dental practices in the sample. Public Google Business Profile data, September 2026. Metros with fewer than 10 dental practices are not reported. Source: Dental Google benchmarks 2026 → -
#33
4.73 — San Francisco has the lowest average rating, at 4.73 stars, against 4.79 nationally.
Sample/method: San Francisco: 114 dental practices in the sample. Public Google Business Profile data, September 2026. Metros with fewer than 10 dental practices are not reported. Source: Dental Google benchmarks 2026 → -
#34
48.8% — 48.8% of dental practices in New York list weekend hours, the highest share of any metro studied.
Sample/method: New York: 127 dental practices in the sample. Public Google Business Profile data, September 2026. Metros with fewer than 10 dental practices are not reported. Source: Dental Google benchmarks 2026 → -
#35
10% — In Nashville, 10% of dental practices list weekend hours, the lowest share of the metros studied.
Sample/method: Nashville: 90 dental practices in the sample. Public Google Business Profile data, September 2026. Metros with fewer than 10 dental practices are not reported. Source: Dental Google benchmarks 2026 → -
#36
16.7% — Boston has the highest share of dental practices with fewer than 50 Google reviews: 16.7%.
Sample/method: Boston: 120 dental practices in the sample. Public Google Business Profile data, September 2026. Metros with fewer than 10 dental practices are not reported. Source: Dental Google benchmarks 2026 → -
#37
43.3% — Las Vegas has the highest share of dental practices with 500 or more Google reviews: 43.3%, against 30.9% nationally.
Sample/method: Las Vegas: 120 dental practices in the sample. Public Google Business Profile data, September 2026. Metros with fewer than 10 dental practices are not reported. Source: Dental Google benchmarks 2026 → -
#38
94% — Philadelphia has the lowest share of dental practice profiles linking a website, at 94%.
Sample/method: Philadelphia: 116 dental practices in the sample. Public Google Business Profile data, September 2026. Metros with fewer than 10 dental practices are not reported. Source: Dental Google benchmarks 2026 → -
#39
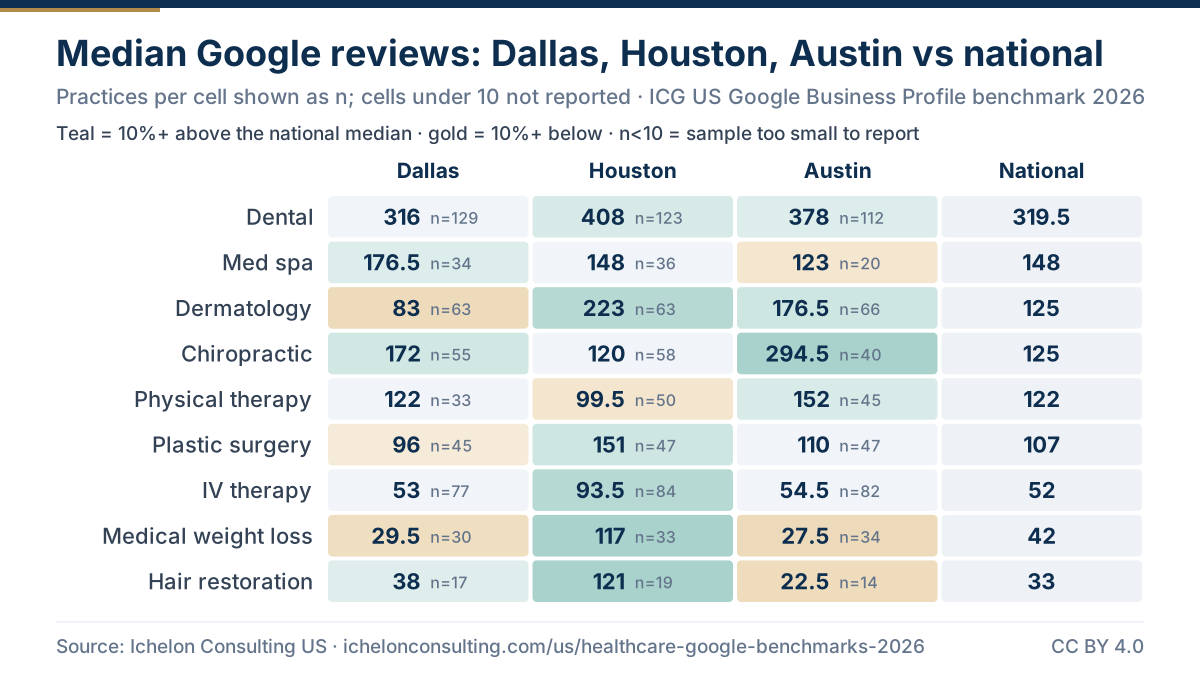
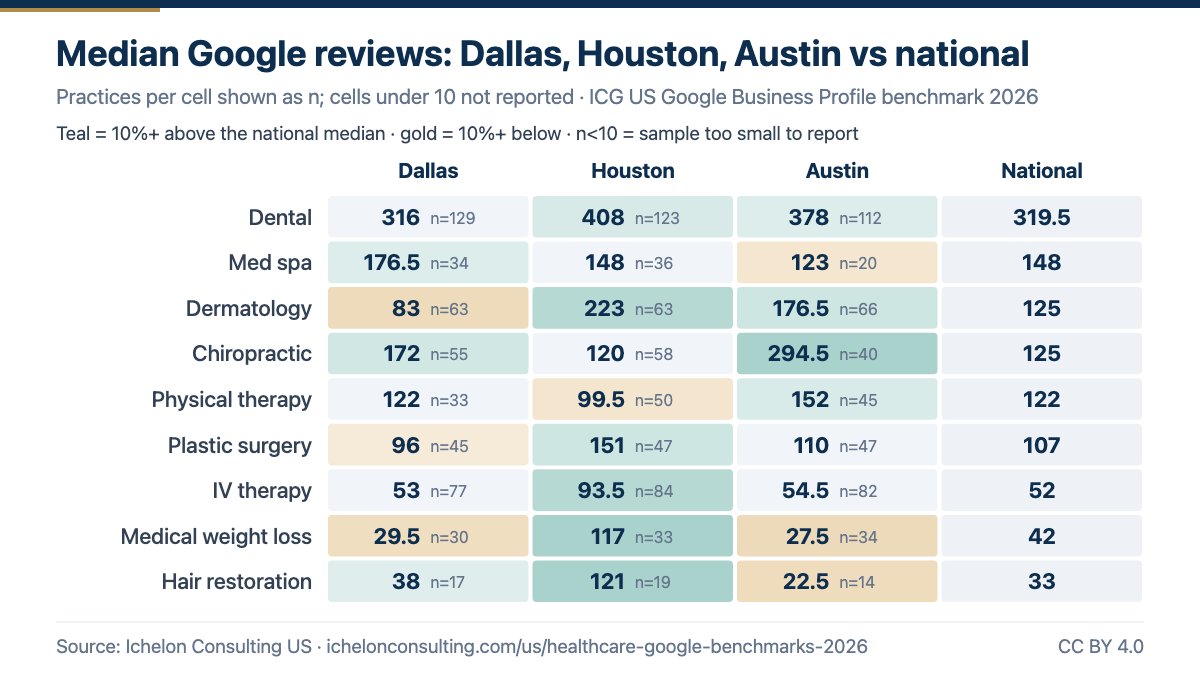
316 — In Texas, the median dental practice has 316 Google reviews in Dallas, 408 in Houston and 378 in Austin.
Sample/method: Dallas: 129; Houston: 123; Austin: 112 dental practices in the sample. Public Google Business Profile data, September 2026. Metros with fewer than 10 dental practices are not reported. Source: Dental Google benchmarks 2026 →
Use this chart
Paste this HTML into your article or blog post. Please keep the source link.
Use this chart
Paste this HTML into your article or blog post. Please keep the source link.
What we found when we studied 2,318 US dental practices on Google
Patients praise the care and the people. Where they push back is the treatment-plan conversation: upselling is the one review theme where complaints dominate.
2,318 US dental practices across 20 metros · review themes, pace and replies from a 120-practice subsample · every headline figure re-derived from raw data.
The US dental market in numbers
Workforce counts from the ADA Health Policy Institute and national spending from CMS.
-
#40
205,088 — There are 205,088 professionally active dentists in the US as of 2025.
Source detail: ADA Health Policy Institute, from The U.S. Dentist Workforce and Supply of Dentists in the U.S.: 2001-2025. Source: ADA Health Policy Institute: The dentist workforce → -
#41
60.0 — The US has 60.0 dentists per 100,000 people (2025), and the ratio varies by state.
Source detail: ADA Health Policy Institute, 2025. Source: ADA Health Policy Institute: The dentist workforce → -
#42
21.2% — About one in five professionally active dentists (21.2%) work in an ADA-recognized specialty (2025).
Source detail: ADA Health Policy Institute, Supply of Dentists in the U.S.: 2001-2025. Source: ADA Health Policy Institute: The dentist workforce → -
#43
39.4% — 39.4% of US dentists are female (2025).
Source detail: ADA Health Policy Institute, 2025. Source: ADA Health Policy Institute: The dentist workforce → -
#44
17.4% — 17.4% of US dentists are under age 35 and 15.2% are 65 or older (2025).
Source detail: ADA Health Policy Institute, 2025. Source: ADA Health Policy Institute: The dentist workforce → -
#45
222,740 — As of May 2026 there are 222,740 dental hygienists and 387,790 dental assistants working in the US.
Source detail: ADA Health Policy Institute, citing the US Bureau of Labor Statistics. Source: ADA Health Policy Institute: The dentist workforce → -
#46
$189.2B — US spending on dental services reached $189.2 billion in 2024.
Source detail: CMS National Health Expenditure Accounts, Table 12, calendar year 2024. Source: CMS National Health Expenditure Accounts, Table 12: Dental Services Expenditures → -
#47
6.6% — Dental services spending grew 6.6% in 2024 over 2023.
Source detail: CMS National Health Expenditure Accounts, Table 12. Source: CMS National Health Expenditure Accounts, Table 12: Dental Services Expenditures → -
#48
38.3% — 38.3% of 2024 US dental spending was paid out of pocket and 41.3% by private health insurance.
Source detail: CMS National Health Expenditure Accounts, Table 12, percent distribution by source of funds, 2024. Source: CMS National Health Expenditure Accounts, Table 12: Dental Services Expenditures →
Key takeaways for practice owners
- Benchmark review count, not stars. Ratings barely move between metros (4.73 to 4.86), but median review counts run from 219 in Seattle to 441 in New York. Compare yourself with your own metro's median, not the national one.
- Review gaps close slowly. At the median pace of 5.17 new reviews a month, a 100-review gap takes about 19 months to close. A steady ask after every visit matters more than a one-off push.
- Weekend hours still stand out. Only 25.5% of practices list weekend hours nationally (10% in Nashville). If you open Saturdays, make sure your Google hours say so.
- Reply to reviews. Owners reply to 49% of reviews on average. Replying to every review, especially the negative ones (without confirming that the reviewer is a patient), is a cheap way to look more responsive than the practice down the street.
- Explain costs before the chair. Upselling (73.9% negative) and price (42.5% negative) are where dental reviews turn sour. Written treatment plans and clear estimates up front protect your rating.
- There is room to grow demand. With 66.7% of adults getting a dental exam or cleaning in a year (CDC), about a third did not. Recall and reactivation campaigns aimed at lapsed patients are a practical place to look for growth.
See where your dental practice sits against these benchmarks
Our free practice visibility audit checks your Google profile, reviews, hours and website against the figures for your metro. Prefer to talk it through? Book a call with the US team in Dallas.
Get the full Dental dataset + PDF summary
The numbers behind this page, ready for your own spreadsheet or slide deck.
- CSV, 21 rows: national figures plus every metro with at least 10 dental practices.
- Fields: average Google rating, median review count, review-count bands, website, phone and hours listed, weekend opening, days open per week.
- PDF summary with the tables, methodology and a citation line.
Public Google Business Profile data for 2,318 US dental practices, September 2026. Aggregates only. Free to reuse under CC BY 4.0.
Where the numbers come from
- Our Google data. Public Google Business Profile data for 2,318 US dental practices in 20 large metros, collected in September 2026. Ratings are averages; review counts are medians, so a few very large practices do not skew them.
- Cross-specialty ranks. Ranks compare national figures for 9,452 practices in 9 specialties studied the same way: healthcare Google benchmarks 2026.
- Review pace and replies. From up to 50 recent Google reviews per practice in a 120-practice subsample. Reported nationally only. Full dental methodology.
- Review themes. 2,992 theme mentions classified by topic and sentiment. Percentages are directional, especially for themes with fewer than 200 mentions.
- Outside figures. Each outside statistic is quoted as its publisher states it, with the year it covers, and links to the primary source. Some come from member surveys or single-region studies; the source detail under each figure says so.
- Publishing rules. Aggregates only. No practice is named, no review text is quoted, and no metro with fewer than 10 dental practices in the sample is reported.
How to cite this page:
Embed our charts: every chart on this page has a “Use this chart” box with copy-ready HTML. The code shows the image and links back to this page as the source. PNG and SVG files are free to reuse under CC BY 4.0 with that credit link.
To cite one figure, link its anchor (for example https://ichelonconsulting.com/us/dental-marketing-statistics-2026#stat-1). For outside figures, please cite the original publisher listed below. Our own data is published under CC BY 4.0: free to reuse with attribution.
Sources used on this page
Ichelon Consulting US research
- Dental Google benchmarks 2026
- State of Dental Google Presence 2026
- Dental Google presence methodology
- Dental patient experience report 2026 (free PDF)
- Dental practice benchmarks for 20 US cities
- Healthcare Google benchmarks 2026 (9 specialties)
Outside sources
- ADA Health Policy Institute, The dentist workforce: FAQs (2025 data, accessed October 2026). https://www.ada.org/resources/research/health-policy-institute/dentist-workforce
- CDC National Center for Health Statistics, FastStats: Oral and Dental Health (last reviewed June 2026). https://www.cdc.gov/nchs/fastats/dental.htm
- CMS Office of the Actuary, National Health Expenditure Accounts, Table 12 Dental Services Expenditures (1970-2024). https://www.cms.gov/data-research/statistics-trends-and-reports/national-health-expenditure-data/historical
- Skrypczak AM, et al. Negative online reviews of orthodontists. Am J Orthod Dentofacial Orthop. 2020;158(2):237-246 (2020). https://pubmed.ncbi.nlm.nih.gov/32746975/
More statistics: med spa marketing statistics 2026 · dermatology marketing statistics 2026 · plastic surgery marketing statistics 2026 · hair restoration marketing statistics 2026 · US healthcare marketing statistics 2026 · all US research.
Related pages from the US team
Med spa marketing statistics 2026
Google, patient and industry data for US med spas.
Dermatology marketing statistics 2026
Google, patient and condition data for US dermatology practices.
Plastic surgery marketing statistics 2026
Google, procedure and patient data for US plastic surgery practices.
Hair restoration marketing statistics 2026
Google, patient and procedure data for US hair restoration clinics.
US healthcare marketing statistics 2026
The cross-specialty statistics page: med spa, dental and 9-specialty figures.
Ichelon Consulting US research
Every US study, dataset and report in one place.
Dental Google benchmarks 2026
The full dental practice benchmark table for all 20 metros.
Dental marketing agency for US practices
How our US team markets dental practices.
Every practice welcome — Goals-Driven engagements from $499/mo
We benchmark your last 90 days, agree monthly goals with you, and track them live on Ichelon Agency OS with a report every Monday. Performance-Linked Payout Models are available. Our US leadership is based in Dallas, and strategy calls run in US business hours.
Common questions
How many Google reviews does the average US dental practice have?
The median US dental practice has 319.5 Google reviews, and 30.9% have 500 or more. By metro the median runs from 219 (Seattle) to 441 (New York). Based on 2,318 practices in 20 metros, September 2026.
What is the average Google rating for a dentist in the US?
The average US dental practice holds a 4.79-star Google rating. Metro averages range from 4.73 to 4.86, so the rating alone rarely separates practices; review count and recency do.
How many new Google reviews does a dental practice get each month?
The median practice gets 5.17 new Google reviews a month, based on recent reviews from a 120-practice sample (September 2026). Owners reply to 49% of reviews on average.
How many dentists are there in the US?
The ADA Health Policy Institute counts 205,088 professionally active dentists in the US as of 2025, or 60.0 per 100,000 people. About one in five (21.2%) work in an ADA-recognized specialty.
What percentage of Americans see a dentist each year?
According to CDC FastStats, 66.7% of adults age 18 and older had a dental exam or cleaning in the past year (2025 National Health Interview Survey early release). For children ages 2 to 17, 86.9% had a dental visit in the past year (2019).
How much do Americans spend on dental care?
CMS puts US spending on dental services at $189.2 billion in 2024, up 6.6% from 2023. Of that, 38.3% was paid out of pocket and 41.3% by private health insurance.
A note on this guide: it explains marketing practice, not legal advice. Rules on privacy, advertising and insurance change and vary by state, so confirm anything compliance-related with your own counsel.
Want your dental practice measured against these numbers?
Book a free 30-minute call with the US team. We compare your Google profile with your metro and specialty figures and tell you what we would fix first.