Dermatology Marketing Statistics 2026
US dermatology practices in 2026: the average practice holds a 4.62-star Google rating, the lowest of the 9 specialties we track, with a median of 125 reviews; 31.1% have fewer than 50 reviews; and acne alone affects up to 50 million Americans a year (AAD).

- 42 statistics in one place: our September 2026 Google data on 1,330 US dermatology practices plus 5 verified outside sources.
- Each figure shows its sample or source and links to the page it came from, so you can check it before you quote it.
- Our data is aggregate only: no practice is named and no metro with fewer than 10 dermatology practices is reported.
- Every practice welcome — retainers from $499/mo, Goals-Driven engagements, Performance-Linked Payout Models available.
- Dallas, Texas LLC
- 10-person US client team · Central Time (CST)
- 25+ US healthcare clients
- BAA signed with every client
- HIPAA compliance training across client and delivery teams
- Contracts and invoices in USD
-
 Primary Care · North Dallas, TXCase study →
-
 MedSpa · North Dallas, TX
-
 Skin Care · Beverly Hills, CA
-
 Dental · Christiansburg, VACase study →
-
 Pediatrics · Blacksburg, VACase study →
-
 Pediatric Dentistry · Blacksburg, VACase study →
-
 Dental · Roanoke, VACase study →
-
 Functional Medicine · Telehealth · USACase study →
“They were able to get all my ideas and work with me over a period of three to four months and create this amazing website. It's super customized, very modern, and it incorporates all the elements that I had wanted — the patient portal, nice pictures, a very interactive website, patient reviews. I would highly recommend their company to anyone who wants to make an excellent website.”
The 7 numbers to know first
This page brings together every citable number we have on how US dermatology practices compete for patients: our own dermatology Google benchmarks for 20 metros, condition counts from the American Academy of Dermatology, published research on reviews and wait times, and cosmetic treatment volumes from the American Society of Plastic Surgeons.
Google ratings and review depth
How 1,330 US dermatology practices look on Google: star ratings, review counts and how they compare with 8 other specialties.
-
#1
4.62 — The average US dermatology practice holds a 4.62-star Google rating.
Sample/method: Public Google Business Profile data for 1,330 US dermatology practices across 20 metros, collected September 2026. Source: Dermatology Google benchmarks 2026 → -
#2
125 — The median US dermatology practice has 125 Google reviews.
Sample/method: Public Google Business Profile data for 1,330 US dermatology practices across 20 metros, collected September 2026. Source: Dermatology Google benchmarks 2026 → -
#3
31.1% — 31.1% of US dermatology practices have fewer than 50 Google reviews.
Sample/method: Public Google Business Profile data for 1,330 US dermatology practices across 20 metros, collected September 2026. Source: Dermatology Google benchmarks 2026 → -
#4
30.2% — 30.2% of dermatology practices have 50 to 199 Google reviews, and 19% have 200 to 499.
Sample/method: Public Google Business Profile data for 1,330 US dermatology practices across 20 metros, collected September 2026. Source: Dermatology Google benchmarks 2026 → -
#5
19.7% — 19.7% of US dermatology practices have 500 or more Google reviews.
Sample/method: Public Google Business Profile data for 1,330 US dermatology practices across 20 metros, collected September 2026. Source: Dermatology Google benchmarks 2026 → -
#6
3rd — Dermatology practices are tied for 3rd of 9 healthcare specialties we benchmarked for median Google review count (125); dental practices lead with a median of 319.5.
Sample/method: National medians across 9,452 US practices in 9 specialties and 20 metros, public Google Business Profile data, September 2026. Source: Healthcare Google benchmarks 2026 (9 specialties) → -
#7
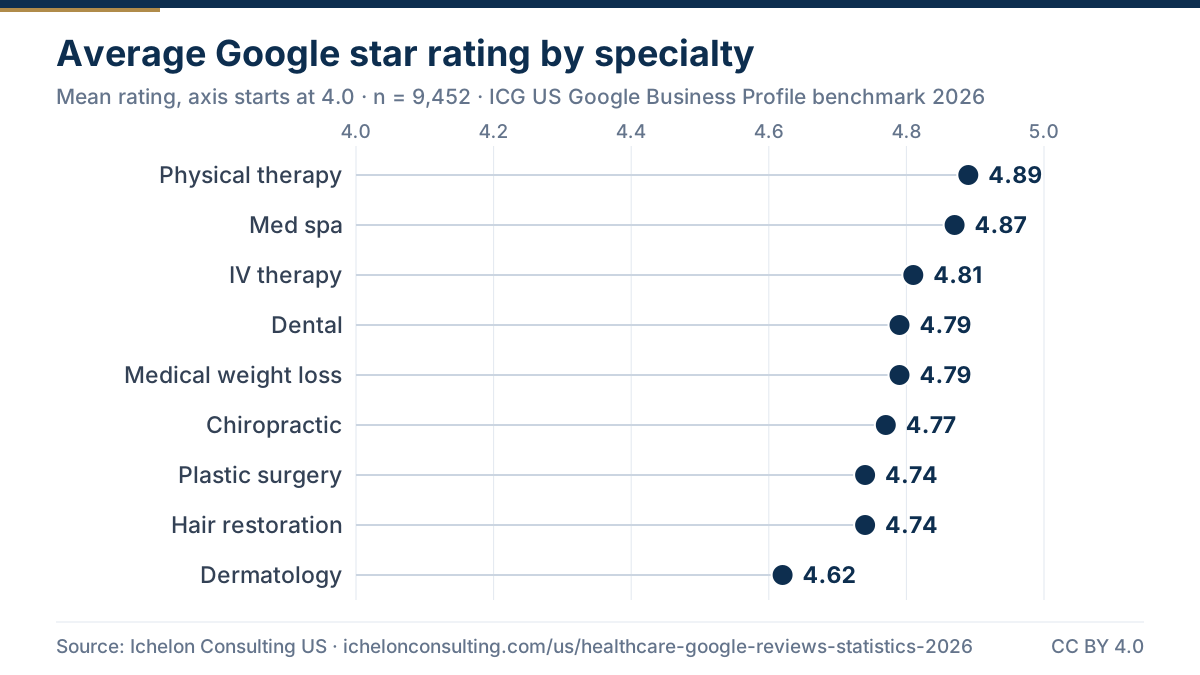
9th — Dermatology practices rank 9th of 9 specialties for average Google rating (4.62 stars); the highest average is 4.89 stars, for physical therapy clinics.
Sample/method: National averages across 9,452 US practices in 9 specialties and 20 metros, September 2026. Source: Healthcare Google benchmarks 2026 (9 specialties) →
Use this chart
Paste this HTML into your article or blog post. Please keep the source link.
What published research says about reviews and access
Peer-reviewed studies on how dermatology practices are rated online and how long patients wait. Older and narrower than our data, but useful context.
-
#8
3.46 vs 4.72 — In a study of 45 dermatology practices in Philadelphia, Houston and Seattle, the average score was 3.46 stars on a general consumer review site but 4.72 on a doctor-booking site.
Source detail: 518 and 4,921 reviews respectively, collected January to July 2015. JAMA Dermatology, 2016. Source: Smith and Lipoff, JAMA Dermatology (2016): dermatology practice online reviews → -
#9
81.0% — In the same study, 81.0% of reviews on the booking site gave 5 stars, against 44.2% on the general review site, and negative experiences were often driven by staff, scheduling, cleanliness and insurance issues rather than the physician.
Source detail: Qualitative and score analysis, JAMA Dermatology, 2016. Source: Smith and Lipoff, JAMA Dermatology (2016): dermatology practice online reviews → -
#10
28.8 days — A secret-shopper study of 186 Michigan dermatology clinics found a mean wait of 28.8 days for the earliest appointment.
Source detail: Calls placed June to July 2016. American Journal of Managed Care, 2020. Source: Huq et al., American Journal of Managed Care (2020): dermatology wait times in Michigan → -
#11
32.9 vs 25.4 — Clinics that accept Medicaid had longer mean waits than those that do not (32.9 vs 25.4 days).
Source detail: 186 Michigan clinics, 2016. American Journal of Managed Care, 2020. Source: Huq et al., American Journal of Managed Care (2020): dermatology wait times in Michigan → -
#12
22.5 vs 40.0 — Patients with Medicaid got appointments sooner for botulinum toxin (22.5 days) than for evaluation of a mole (40.0 days) or a rash (40.1 days).
Source detail: 186 Michigan clinics, 2016. American Journal of Managed Care, 2020. Source: Huq et al., American Journal of Managed Care (2020): dermatology wait times in Michigan →
Profile completeness, hours and weekend access
The listing details that turn a Google search into a call or a booking: website link, phone number, published hours and weekend opening.
-
#13
95.4% — 95.4% of US dermatology practice Google profiles link to a website.
Sample/method: Public Google Business Profile data for 1,330 US dermatology practices across 20 metros, collected September 2026. Source: Dermatology Google benchmarks 2026 → -
#14
98.5% — 98.5% of dermatology practice profiles list a phone number.
Sample/method: Public Google Business Profile data for 1,330 US dermatology practices across 20 metros, collected September 2026. Source: Dermatology Google benchmarks 2026 → -
#15
93% — 93% of dermatology practice profiles publish opening hours.
Sample/method: Public Google Business Profile data for 1,330 US dermatology practices across 20 metros, collected September 2026. Source: Dermatology Google benchmarks 2026 → -
#16
27.5% — 27.5% of US dermatology practices list hours on at least one weekend day.
Sample/method: Public Google Business Profile data for 1,330 US dermatology practices across 20 metros, collected September 2026. Based on hours listed on the profile. Source: Dermatology Google benchmarks 2026 → -
#17
4.8 — The average dermatology practice is open 4.8 days a week, based on listed hours.
Sample/method: Public Google Business Profile data for 1,330 US dermatology practices across 20 metros, collected September 2026. Source: Dermatology Google benchmarks 2026 → -
#18
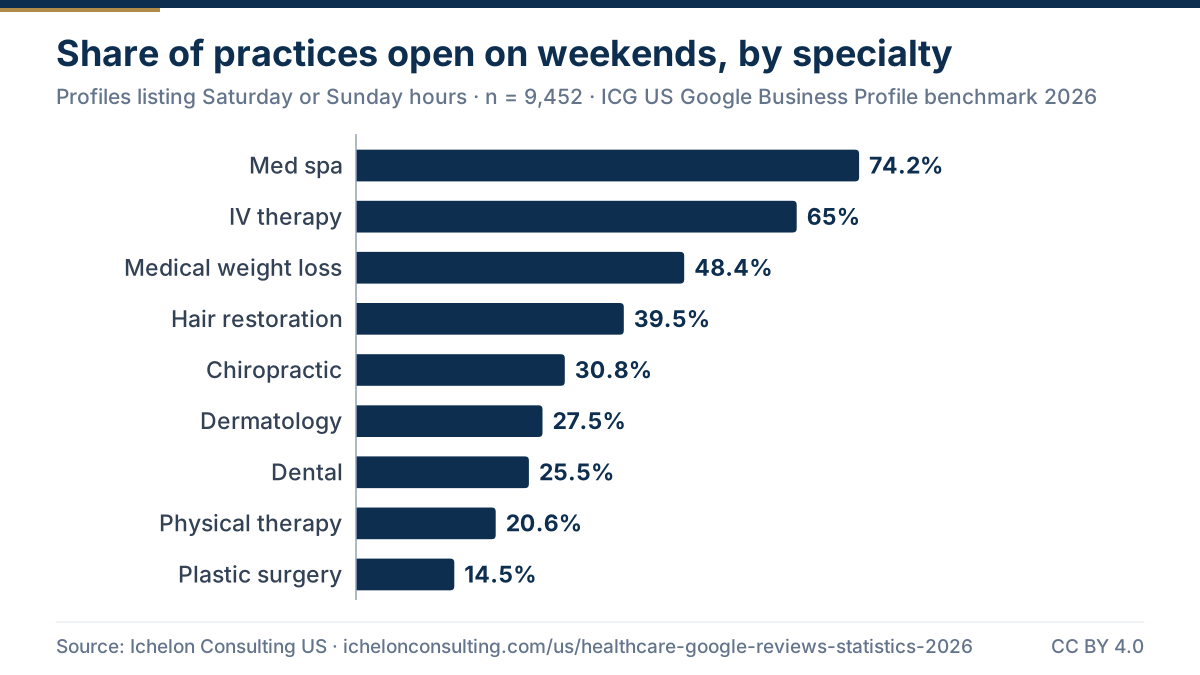
6th — Dermatology practices rank 6th of 9 specialties for weekend opening; med spas are most likely to open on weekends (74.2%).
Sample/method: National shares across 9,452 US practices in 9 specialties, September 2026. Based on hours listed on the profile. Source: Healthcare Google benchmarks 2026 (9 specialties) → -
#19
9th — Dermatology practices rank 9th of 9 specialties for publishing opening hours on Google (93%); the highest share is 99.5%, for physical therapy clinics.
Sample/method: National shares across 9,452 US practices in 9 specialties, September 2026. Source: Healthcare Google benchmarks 2026 (9 specialties) →
Use this chart
Paste this HTML into your article or blog post. Please keep the source link.
How many Americans need a dermatologist
Condition counts from the American Academy of Dermatology (AAD). These are the patient pools that medical dermatology marketing speaks to.
-
#20
50 million — Acne is the most common skin condition in the US, affecting up to 50 million Americans each year.
Source detail: American Academy of Dermatology, which footnotes each figure to its underlying study. Source: American Academy of Dermatology: Skin conditions by the numbers → -
#21
85% — Approximately 85% of people between the ages of 12 and 24 experience at least minor acne, and adult acne affects up to 15% of women.
Source detail: American Academy of Dermatology, which footnotes each figure to its underlying study. Source: American Academy of Dermatology: Skin conditions by the numbers → -
#22
1 in 10 — Atopic dermatitis affects nearly 1 in 10 Americans of all ages and up to 1 in 5 children under 18.
Source detail: American Academy of Dermatology, which footnotes each figure to its underlying study. Source: American Academy of Dermatology: Skin conditions by the numbers → -
#23
7.5 million — Psoriasis affects nearly 7.5 million people in the US.
Source detail: American Academy of Dermatology, which footnotes each figure to its underlying study. Source: American Academy of Dermatology: Skin conditions by the numbers → -
#24
1 in 5 — Skin cancer is the most common cancer in the US, and one in five Americans will develop skin cancer in their lifetime.
Source detail: American Academy of Dermatology, which footnotes each figure to its underlying study. Source: American Academy of Dermatology: Skin cancer statistics → -
#25
9,500 — Approximately 9,500 people in the US are diagnosed with skin cancer every day.
Source detail: American Academy of Dermatology, which footnotes each figure to its underlying study. Source: American Academy of Dermatology: Skin cancer statistics → -
#26
234,680 — An estimated 234,680 new cases of melanoma (122,680 noninvasive and 112,000 invasive) will be diagnosed in the US in 2026.
Source detail: American Academy of Dermatology, which footnotes each figure to its underlying study. Source: American Academy of Dermatology: Skin cancer statistics → -
#27
80 million — Hereditary hair loss (androgenetic alopecia) affects an estimated 80 million Americans: 50 million men and 30 million women.
Source detail: American Academy of Dermatology, which footnotes each figure to its underlying study. Source: American Academy of Dermatology: Skin conditions by the numbers →
How the 20 metros compare
Metro figures for dermatology practices, ranked. Only metros with at least 10 dermatology practices in the sample are reported.
-
#28
513.5 — New York has the deepest review profiles of the 20 metros studied: the median dermatology practice there has 513.5 Google reviews.
Sample/method: New York: 74 dermatology practices in the sample. Public Google Business Profile data, September 2026. Metros with fewer than 10 dermatology practices are not reported. Source: Dermatology Google benchmarks 2026 → -
#29
43 — San Diego has the thinnest, at a median of 43 reviews; the top metro's median is 11.9 times as high.
Sample/method: San Diego: 78 dermatology practices in the sample. Public Google Business Profile data, September 2026. Metros with fewer than 10 dermatology practices are not reported. Source: Dermatology Google benchmarks 2026 → -
#30
9 of 20 — In 9 of the 20 metros studied, the median dermatology practice has more Google reviews than the national median of 125.
Sample/method: Public Google Business Profile data for 1,330 US dermatology practices across 20 metros, collected September 2026. Source: Dermatology Google benchmarks 2026 → -
#31
4.81 — Austin and Scottsdale have the highest average Google rating for dermatology practices among the metros studied, at 4.81 stars.
Sample/method: Austin: 66; Scottsdale: 65 dermatology practices in the sample. Public Google Business Profile data, September 2026. Metros with fewer than 10 dermatology practices are not reported. Source: Dermatology Google benchmarks 2026 → -
#32
4.31 — Seattle has the lowest average rating, at 4.31 stars, against 4.62 nationally.
Sample/method: Seattle: 63 dermatology practices in the sample. Public Google Business Profile data, September 2026. Metros with fewer than 10 dermatology practices are not reported. Source: Dermatology Google benchmarks 2026 → -
#33
59.5% — 59.5% of dermatology practices in New York list weekend hours, the highest share of any metro studied.
Sample/method: New York: 74 dermatology practices in the sample. Public Google Business Profile data, September 2026. Metros with fewer than 10 dermatology practices are not reported. Source: Dermatology Google benchmarks 2026 → -
#34
12.1% — In Austin, 12.1% of dermatology practices list weekend hours, the lowest share of the metros studied.
Sample/method: Austin: 66 dermatology practices in the sample. Public Google Business Profile data, September 2026. Metros with fewer than 10 dermatology practices are not reported. Source: Dermatology Google benchmarks 2026 → -
#35
57.7% — San Diego has the highest share of dermatology practices with fewer than 50 Google reviews: 57.7%.
Sample/method: San Diego: 78 dermatology practices in the sample. Public Google Business Profile data, September 2026. Metros with fewer than 10 dermatology practices are not reported. Source: Dermatology Google benchmarks 2026 → -
#36
50% — New York has the highest share of dermatology practices with 500 or more Google reviews: 50%, against 19.7% nationally.
Sample/method: New York: 74 dermatology practices in the sample. Public Google Business Profile data, September 2026. Metros with fewer than 10 dermatology practices are not reported. Source: Dermatology Google benchmarks 2026 → -
#37
84.6% — San Diego has the lowest share of dermatology practice profiles linking a website, at 84.6%.
Sample/method: San Diego: 78 dermatology practices in the sample. Public Google Business Profile data, September 2026. Metros with fewer than 10 dermatology practices are not reported. Source: Dermatology Google benchmarks 2026 → -
#38
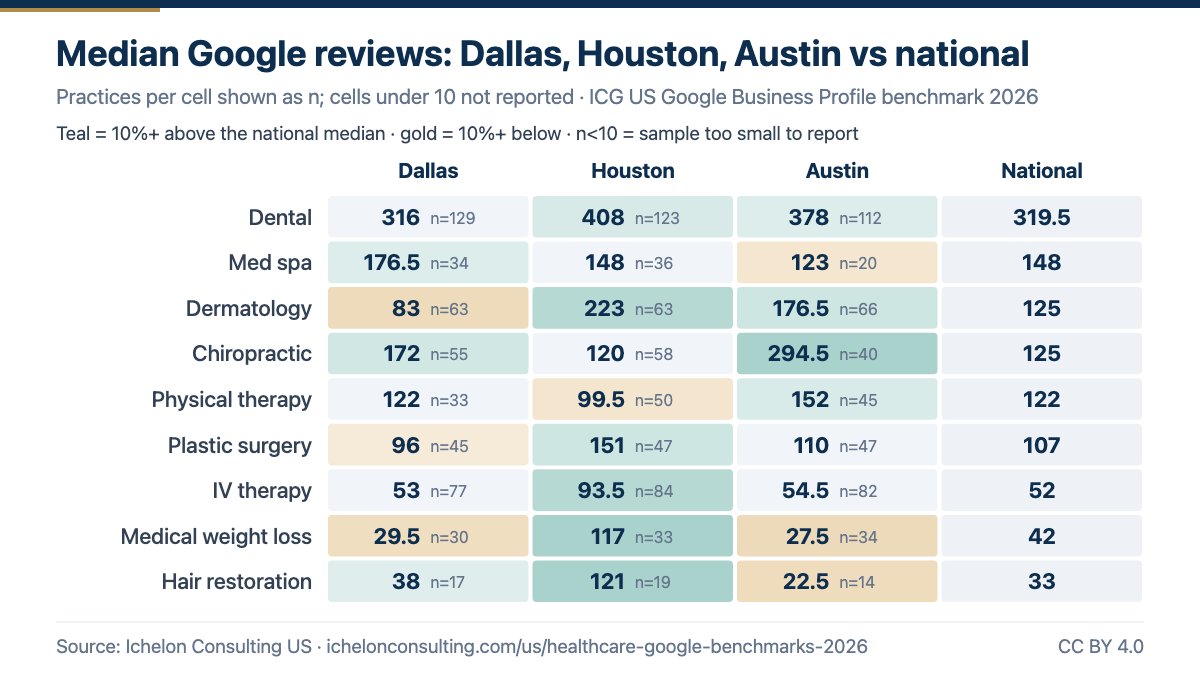
83 — In Texas, the median dermatology practice has 83 Google reviews in Dallas, 223 in Houston and 176.5 in Austin.
Sample/method: Dallas: 63; Houston: 63; Austin: 66 dermatology practices in the sample. Public Google Business Profile data, September 2026. Metros with fewer than 10 dermatology practices are not reported. Source: Dermatology Google benchmarks 2026 →
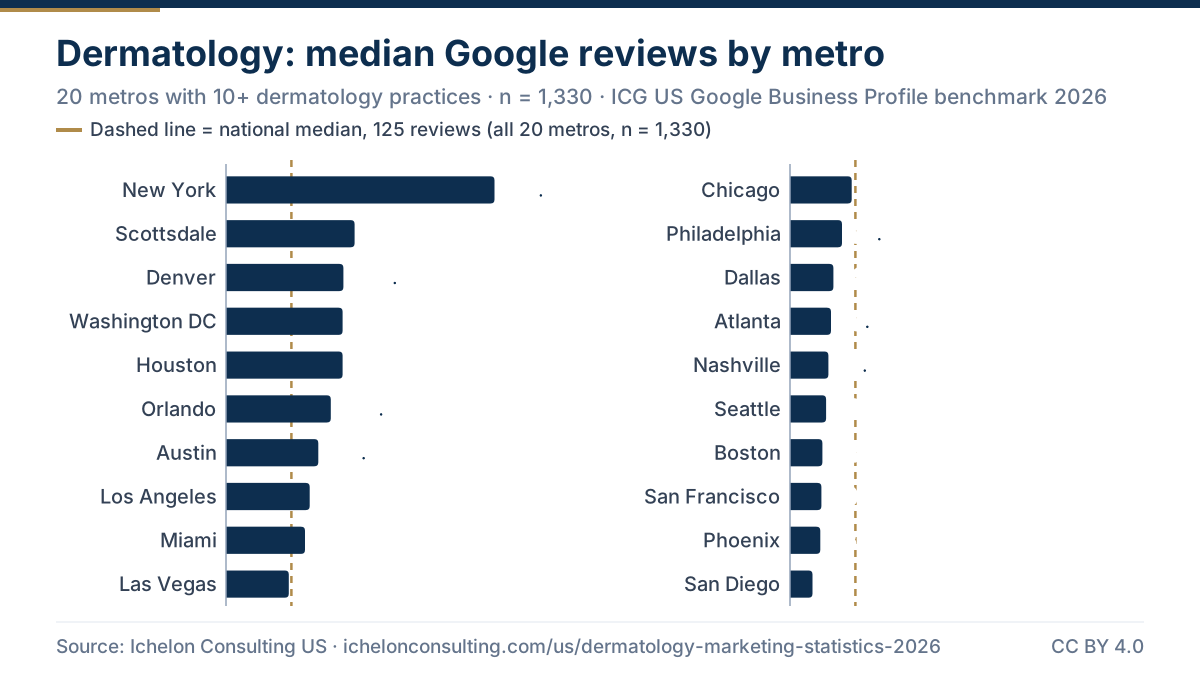
Use this chart
Paste this HTML into your article or blog post. Please keep the source link.
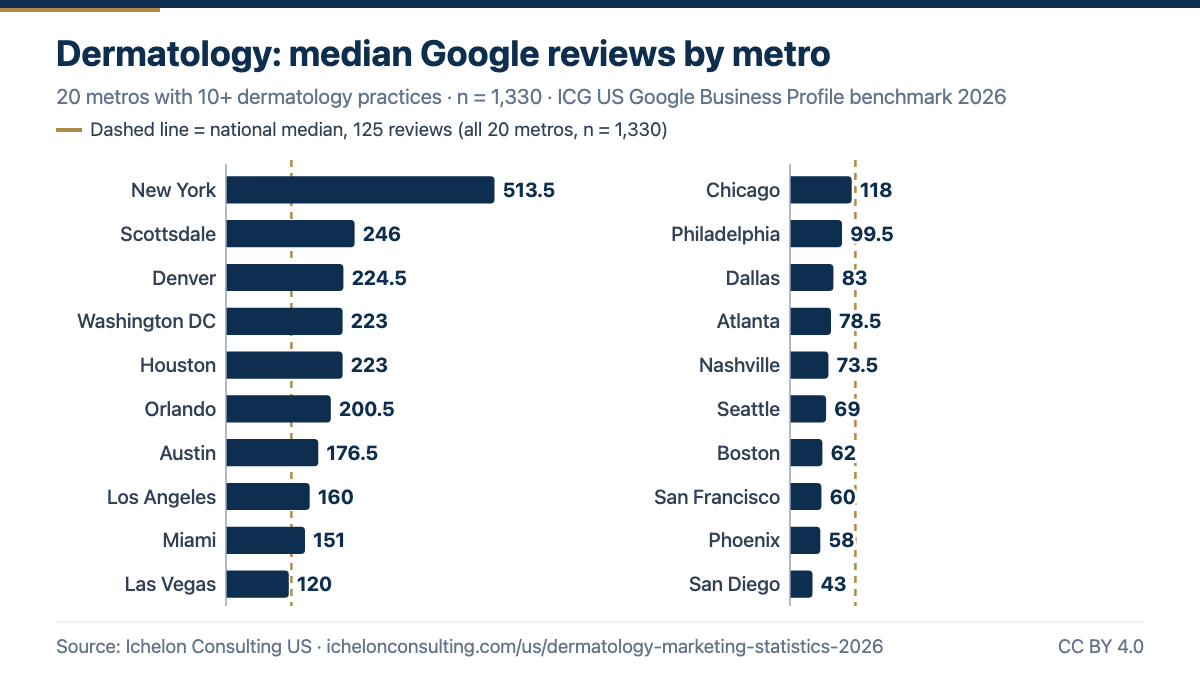
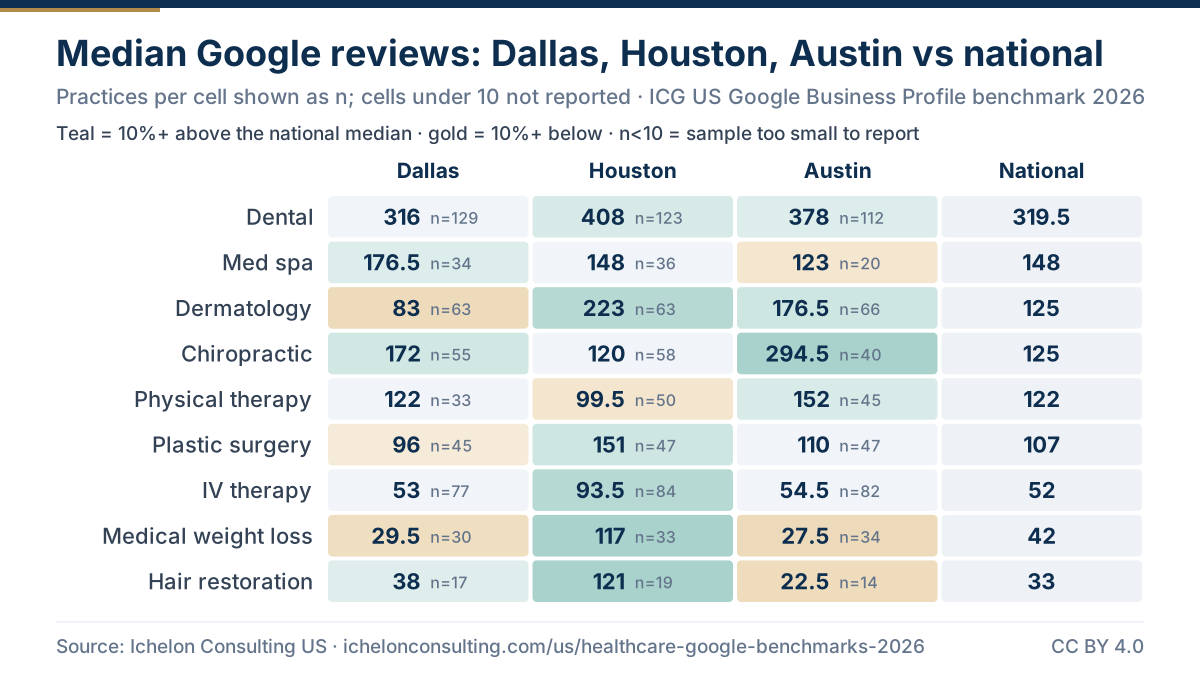
Use this chart
Paste this HTML into your article or blog post. Please keep the source link.
Cosmetic treatment volumes
National volumes for the minimally invasive treatments many dermatology practices offer, from the American Society of Plastic Surgeons (ASPS).
-
#39
9,883,711 — Neuromodulator injections were the top minimally invasive treatment in the US in 2024, at 9,883,711 procedures, up 4% year over year.
Source detail: ASPS 2024 Procedural Statistics, released June 25, 2025. Source: American Society of Plastic Surgeons: 2024 Procedural Statistics release → -
#40
5,331,426 — Hyaluronic acid filler procedures totaled 5,331,426 in 2024.
Source detail: ASPS 2024 Procedural Statistics, released June 25, 2025. Source: American Society of Plastic Surgeons: 2024 Procedural Statistics release → -
#41
3,703,305 — Skin resurfacing procedures (such as chemical peels, laser resurfacing and microdermabrasion) totaled 3,703,305 in 2024.
Source detail: ASPS 2024 Procedural Statistics, released June 25, 2025. Source: American Society of Plastic Surgeons: 2024 Procedural Statistics release → -
#42
361,798 — Tumor removal, including skin cancer, was the most common reconstructive procedure in 2024, at 361,798 procedures.
Source detail: ASPS 2024 Procedural Statistics, released June 25, 2025. Source: American Society of Plastic Surgeons: 2024 Procedural Statistics release →
Key takeaways for practice owners
- Ratings need active care in this specialty. Dermatology averages 4.62 stars (they rank 9th of 9 specialties we track), and metro averages drop to 4.31 in Seattle. Research ties many bad reviews to staff, scheduling and insurance, so front-desk and scheduling fixes are a good place to start.
- Review depth splits the market. The median practice has 125 reviews, but 31.1% have fewer than 50, and metro medians run from 43 in San Diego to 513.5 in New York. In thin markets, a steady review program is a real edge.
- Publish your hours. Only 93% of dermatology profiles show opening hours. Missing hours make a practice look closed or uncertain on Google.
- Sell access. In one state study, the mean wait for the earliest available appointment was 28.8 days. If you can see new patients sooner, say so on your profile, website and ads.
- Run medical and cosmetic as separate funnels. Medical demand is huge (acne up to 50 million Americans a year; skin cancer in 1 in 5 over a lifetime), and cosmetic demand is too (9.9 million neuromodulator procedures in 2024). The two audiences search differently; see our cosmetic dermatology marketing page.
See where your dermatology practice sits against these benchmarks
Our free practice visibility audit checks your Google profile, reviews, hours and website against the figures for your metro. Prefer to talk it through? Book a call with the US team in Dallas.
Get the full Dermatology dataset + PDF summary
The numbers behind this page, ready for your own spreadsheet or slide deck.
- CSV, 21 rows: national figures plus every metro with at least 10 dermatology practices.
- Fields: average Google rating, median review count, review-count bands, website, phone and hours listed, weekend opening, days open per week.
- PDF summary with the tables, methodology and a citation line.
Public Google Business Profile data for 1,330 US dermatology practices, September 2026. Aggregates only. Free to reuse under CC BY 4.0.
Where the numbers come from
- Our Google data. Public Google Business Profile data for 1,330 US dermatology practices in 20 large metros, collected in September 2026. Ratings are averages; review counts are medians, so a few very large practices do not skew them.
- Cross-specialty ranks. Ranks compare national figures for 9,452 practices in 9 specialties studied the same way: healthcare Google benchmarks 2026.
- Outside figures. Each outside statistic is quoted as its publisher states it, with the year it covers, and links to the primary source. Some come from member surveys or single-region studies; the source detail under each figure says so.
- Publishing rules. Aggregates only. No practice is named, no review text is quoted, and no metro with fewer than 10 dermatology practices in the sample is reported.
How to cite this page:
Embed our charts: every chart on this page has a “Use this chart” box with copy-ready HTML. The code shows the image and links back to this page as the source. PNG and SVG files are free to reuse under CC BY 4.0 with that credit link.
To cite one figure, link its anchor (for example https://ichelonconsulting.com/us/dermatology-marketing-statistics-2026#stat-1). For outside figures, please cite the original publisher listed below. Our own data is published under CC BY 4.0: free to reuse with attribution.
Sources used on this page
Ichelon Consulting US research
- Dermatology Google benchmarks 2026
- Healthcare Google benchmarks 2026 (9 specialties)
- US healthcare marketing statistics 2026
Outside sources
- American Academy of Dermatology, Skin conditions by the numbers (accessed October 2026). https://www.aad.org/media/stats-numbers
- American Academy of Dermatology, Skin cancer (accessed October 2026). https://www.aad.org/media/stats-skin-cancer
- Smith RJ, Lipoff JB. Evaluation of Dermatology Practice Online Reviews: Lessons From Qualitative Analysis. JAMA Dermatol. 2016;152(2):153-157 (2016). https://pubmed.ncbi.nlm.nih.gov/26606326/
- Huq F, et al. Association of dermatology wait times with insurance coverage in Michigan. Am J Manag Care. 2020;26(10):432-437 (2020). https://pubmed.ncbi.nlm.nih.gov/33094938/
- American Society of Plastic Surgeons, 2024 Procedural Statistics press release (June 25, 2025). https://www.plasticsurgery.org/news/press-releases/interest-in-aesthetic-health-remained-consistent-despite-economic-uncertainty-in-2024-according-to-new-report-from-american-society-of-plastic-surgeons
More statistics: dental marketing statistics 2026 · med spa marketing statistics 2026 · plastic surgery marketing statistics 2026 · hair restoration marketing statistics 2026 · US healthcare marketing statistics 2026 · all US research.
Related pages from the US team
Dental marketing statistics 2026
Google, patient and market data for US dental practices.
Med spa marketing statistics 2026
Google, patient and industry data for US med spas.
Plastic surgery marketing statistics 2026
Google, procedure and patient data for US plastic surgery practices.
Hair restoration marketing statistics 2026
Google, patient and procedure data for US hair restoration clinics.
US healthcare marketing statistics 2026
The cross-specialty statistics page: med spa, dental and 9-specialty figures.
Ichelon Consulting US research
Every US study, dataset and report in one place.
Dermatology Google benchmarks 2026
The full dermatology practice benchmark table for all 20 metros.
Dermatology marketing agency for US practices
How our US team markets dermatology practices.
Every practice welcome — Goals-Driven engagements from $499/mo
We benchmark your last 90 days, agree monthly goals with you, and track them live on Ichelon Agency OS with a report every Monday. Performance-Linked Payout Models are available. Our US leadership is based in Dallas, and strategy calls run in US business hours.
Common questions
What is the average Google rating for a dermatologist in the US?
The average US dermatology practice holds a 4.62-star Google rating, based on 1,330 practices across 20 metros (September 2026). Dermatology practices rank 9th of 9 specialties we benchmarked, and metro averages range from 4.31 to 4.81.
How many Google reviews does a dermatology practice have?
The median US dermatology practice has 125 Google reviews. 31.1% have fewer than 50 and 19.7% have 500 or more. New York has the deepest profiles, with a median of 513.5.
How common are skin conditions in the US?
According to the American Academy of Dermatology, acne affects up to 50 million Americans each year, atopic dermatitis affects nearly 1 in 10, psoriasis affects nearly 7.5 million, and one in five Americans will develop skin cancer in their lifetime.
How long do patients wait to see a dermatologist?
A secret-shopper study of 186 Michigan dermatology clinics (2016, published 2020) found a mean wait of 28.8 days for the earliest appointment, and longer waits at clinics that accept Medicaid (32.9 vs 25.4 days). Waits vary by region and reason for visit.
Are dermatology practices open on weekends?
Only 27.5% of US dermatology practices list weekend hours on Google. The share ranges from 12.1% in Austin to 59.5% in New York.
Where do these dermatology statistics come from?
Our own figures come from public Google Business Profile data for 1,330 dermatology practices in 20 US metros, collected in September 2026 and published as aggregates. Outside figures come from the American Academy of Dermatology, the American Society of Plastic Surgeons and two peer-reviewed studies, each linked under the figure.
A note on this guide: it explains marketing practice, not legal advice. Rules on privacy, advertising and insurance change and vary by state, so confirm anything compliance-related with your own counsel.
Want your dermatology practice measured against these numbers?
Book a free 30-minute call with the US team. We compare your Google profile with your metro and specialty figures and tell you what we would fix first.