


Healthcare YouTube benchmarks in India 2026: subscriber growth, retention, CTR, and what "good" actually looks like
Healthcare YouTube benchmarks for Indian channels in 2026 sit in different bands than generic creator benchmarks — subscriber growth, average view duration, thumbnail CTR, search discovery share, upload consistency, and comment-to-view ratio all behave differently for clinical content. This guide gives percentile bands (25th, 50th, 75th, 90th) sourced from ICG's observations across managed channels.
No pitch. Written root-cause diagnosis. AI-powered, healthcare only.
Direct answer
Healthcare YouTube benchmarks for Indian channels in 2026 sit in different bands than generic creator benchmarks — subscriber growth, average view duration, thumbnail CTR, search discovery share, upload consistency, and comment-to-view ratio all behave differently for clinical co...
TL;DR

Healthcare YouTube benchmarks for Indian channels in 2026 do not follow the numbers most creator benchmark reports publish, because healthcare content behaves differently across every metric that matters — audiences are narrower, watch intent is more considered, retention is higher on average, thumbnail CTR is lower on average, and subscriber conversion is meaningfully slower. Clinic marketing teams comparing themselves against generic creator benchmarks routinely conclude their channels are failing when they are actually performing within healthy specialty-specific bands. This guide provides percentile bands — 25th, 50th, 75th, 90th — for six benchmark axes, sourced from ICG's aggregate observations across healthcare channels managed via YODA, and ladders back to the healthcare YouTube marketing service.
Why generic YouTube benchmarks mislead healthcare channels systematically
Public creator benchmarks — the ones frequently cited from vidIQ, TubeBuddy, or industry surveys — are aggregated across gaming, lifestyle, education, entertainment, product review, and business channels. Healthcare is a small slice of that aggregate and its distribution sits far from the median on most axes.
Healthcare thumbnail CTR is lower than the generic average because thumbnails cannot use the sensationalist visual grammar (shock face, oversized text, colour saturation) that drives clicks in entertainment content — NMC ethics guidelines discourage sensationalism in medical marketing. Healthcare retention is higher than the generic average because viewers arrive with high intent (they are researching a real medical concern) and stay for content that answers their question. Healthcare subscriber conversion is slower because a subscription decision follows several videos rather than a single-video impulse.
Comparing a healthcare channel against generic benchmarks produces false negatives (channels that are performing well look bad on generic thumbnail-CTR benchmarks) and false positives (channels that are performing poorly look fine on generic retention benchmarks because healthcare retention is naturally elevated). Specialty-specific benchmarks are the only useful reference.
These benchmark bands are drawn from ICG's observations across managed healthcare channels using YODA and are directional rather than statistically definitive — a channel outside the bands is not automatically failing, and a channel inside them is not automatically winning. They are calibration points for informed judgement.
Subscriber growth rate — percentile bands for Indian healthcare channels
Subscriber growth is expressed here as month-over-month percentage growth on organic activity only, excluding subscribers acquired through paid promotion. Numbers are for channels between 500 and 25,000 subscribers — mature channels grow more slowly in percentage terms simply because the base is larger.
25th percentile: 2% MoM organic subscriber growth. Below this band, the channel either has weak content quality, weak topic selection, weak SEO, or all three. Recovery requires diagnostic work on which axis is dragging.
50th percentile: 8% MoM organic subscriber growth. This is what a well-run healthcare channel looks like in month-over-month organic terms. Not glamorous, but compounding — an 8% monthly compound rate takes a 1,000-subscriber channel to ~2,500 in twelve months.
75th percentile: 15% MoM organic subscriber growth. Strong performance driven by consistent upload cadence, well-optimised topic selection, and strong retention. Sustaining this rate over 12+ months is rare and usually reflects excellent editorial discipline.
90th percentile: 25%+ MoM organic subscriber growth. Rare. Usually associated with a specific topic gaining sudden search interest (a new treatment gaining public attention, a policy change driving educational demand) combined with strong pre-existing content coverage of that topic.
Average view duration benchmarks by video length
Average view duration matters more than percentage retention for YouTube's algorithm because absolute watch time is what compounds session watch time. Benchmarks are broken by video length because retention percentages behave differently for short versus long content.
For 5-8 minute videos (the most common healthcare long-form length): 25th percentile 1:45, 50th percentile 3:00, 75th percentile 4:15, 90th percentile 5:30. A well-performing 6-minute explainer video should hold audiences for 3 minutes or more on average.
For 8-15 minute videos (deep procedure explainers, condition guides): 25th percentile 2:30, 50th percentile 4:30, 75th percentile 6:30, 90th percentile 8:30. Healthcare audiences will stay significantly longer on longer content than the generic YouTube norm suggests.
For 15-25 minute videos (comprehensive guides, Q&A compilations): 25th percentile 4:00, 50th percentile 7:00, 75th percentile 10:00, 90th percentile 13:00. The longer the video, the more retention advantage a well-scripted healthcare piece has over generic long-form content.
For Shorts (under 60 seconds): 25th percentile 18 seconds, 50th percentile 32 seconds, 75th percentile 45 seconds, 90th percentile 58 seconds. Full-completion rate on healthcare Shorts is typically 30% to 50% — high compared to entertainment Shorts, low compared to Instagram Reels.
Thumbnail click-through rate bands for healthcare — lower than you've been told
Thumbnail CTR — the percentage of impressions that resulted in a click on the thumbnail — is measured inside the YouTube Studio Reach tab. Generic creator benchmarks often cite "healthy CTR" as 6% to 10%. Healthcare channels rarely sit in that band.
25th percentile: 2.5% CTR. Below this, thumbnail or title is actively suppressing performance. Redesign is warranted.
50th percentile: 4.5% CTR. Normal for well-designed healthcare thumbnails without sensationalist visual grammar.
75th percentile: 6.5% CTR. Strong performance. Usually reflects thumbnails with clear specialty signalling, credentialed on-screen presence, and text overlays that answer a search intent.
90th percentile: 9%+ CTR. Exceptional. Almost always requires professional thumbnail design, tested variants, and consistent visual identity across the channel that makes thumbnails recognisable in a browsing feed.
Channels chasing generic 10%+ CTR benchmarks often drift into sensationalist thumbnails that violate NMC advertising ethics guidelines — a short-term CTR gain that produces long-term compliance risk and channel-strike exposure.
Search discovery share of total views — the sustainability signal
Search discovery share is the percentage of total organic views that came from YouTube search + Google web search combined, as opposed to Suggested, Browse, Notifications, or External sources. It matters because search-discovery views are the most durable — they continue accruing months and years after publication.
25th percentile: 18% search share. Below this, the channel is over-dependent on Suggested and Browse — which means the channel is being carried by the algorithm's current favour rather than by durable searchable content.
50th percentile: 32% search share. Healthy dependency mix. Search share is doing its job producing long-tail durable traffic while Suggested and Browse handle discovery of new-viewer segments.
75th percentile: 48% search share. Strong sustainability. Videos are ranking for meaningful healthcare search queries and producing traffic without needing algorithm-favour spikes.
90th percentile: 62%+ search share. A channel this search-heavy is essentially operating like an evergreen healthcare knowledge base — highly durable but often growing slower in raw subscriber counts because Suggested-driven virality is not part of the mix.
Upload consistency bands — the metric that quietly compounds
Upload consistency is expressed as the standard deviation of days between uploads. Lower is better because the algorithm reads consistency as a signal of active-channel status.
25th percentile: high inconsistency (>14 day standard deviation). The channel goes weeks without uploads, then batches. Algorithm favour is unstable.
50th percentile: moderate consistency (~7 day standard deviation). Weekly upload with occasional missed weeks. Algorithm treats channel as active.
75th percentile: strong consistency (~3 day standard deviation). Reliable cadence — twice-weekly, weekly, or fortnightly with narrow variance. Algorithm favour is stable and predictable.
90th percentile: near-perfect consistency (<2 day standard deviation). Rare in healthcare because production overhead is high. Usually associated with dedicated video production teams or agency-supported channels.
The specific cadence (weekly vs fortnightly vs twice-weekly) matters less than the consistency of whatever cadence is chosen. A channel uploading every Tuesday for 18 months outperforms a channel uploading 3 videos one week and none for a month.
Comment-to-view ratio and what it tells you about audience trust
Comment-to-view ratio is expressed as comments per 1,000 organic views. It's a proxy for how engaged the audience is beyond passive watching.
25th percentile: 0.4 comments per 1,000 views. Low engagement. Either the content is passive-consumption oriented (which is fine for reach but weak for trust building) or the audience is not developing a relationship with the channel.
50th percentile: 1.2 comments per 1,000 views. Healthy. Viewers ask follow-up questions, share experiences, express thanks. This is where the channel starts producing patient-question data that feeds future content.
75th percentile: 2.5 comments per 1,000 views. Strong community engagement. Usually reflects consistent creator responsiveness in the comments section — patients see replies and are more likely to comment themselves.
90th percentile: 4.5+ comments per 1,000 views. Exceptional. Almost always associated with a channel where the on-screen doctor actively responds to comments and audiences know their questions will be answered.
Comment responsiveness on healthcare channels is a compliance-sensitive activity. Replies must not offer clinical advice, must not diagnose based on comment descriptions, and must not identify patients. Templated response patterns aligned with NMC and DPDP restrictions are essential.
How to use these benchmarks without forcing bad decisions
The correct use of benchmarks is diagnostic — where is a channel sitting on each axis and which axis is dragging most. The wrong use is target-setting — treating the 75th percentile as a goal on every axis simultaneously creates conflicting priorities that produce bad content.
A channel with strong CTR but weak retention should not simultaneously push both harder. It should investigate the retention cliff first, because CTR that drives viewers who don't stay produces worse algorithm favour than moderate CTR with strong retention.
A channel with weak search discovery share but strong Suggested share should not attempt to shift the mix rapidly. Suggested-driven views are still valuable — the play is to build search share alongside, not at the expense of, existing Suggested strength.
A channel below 25th percentile on multiple axes simultaneously is not going to fix itself with cadence increases or thumbnail A/B tests. It needs the full YODA workflow — Overview through Diagnostics through Strategy — to identify which underlying axis is the root cause. Symptom-treating produces marginal gains; root-cause treatment produces compounding gains.
Benchmark bands also shift over time. NMC compliance updates, algorithm changes, and audience behaviour shifts move the specialty-specific bands by 10% to 20% year over year. The bands in this guide reflect 2026 observations and will be re-calibrated in 2027 as data updates.
The compliance note that shapes every benchmark in this guide
Every band published here assumes a channel operating inside the NMC's 2026 advertising guidelines, the DPDP Act 2023, and the ASCI Guidelines. Channels chasing higher CTR or higher subscriber velocity by ignoring compliance perimeter — using sensationalist thumbnails, publishing patient testimonials without consent, making unsubstantiated outcome claims — will show inflated short-term metrics that collapse when a channel strike or a compliance complaint arrives.
Sustainable healthcare YouTube performance sits inside the compliance perimeter. The benchmark bands above are what "good" looks like when the perimeter is respected, and no metric is worth violating it for.
The platform ICG uses to run this at scale: YODA
ICG runs healthcare YouTube marketing for clinics, hospitals, and specialty groups using YODA — our AI-native healthcare YouTube marketing platform. YODA sits on top of a channel's data and does four things no dashboard does: it separates organic from paid views at every step (so a promoted video can never masquerade as organic growth), it gives decisions not dashboards (every video gets a state + next action), it writes back to YouTube directly (improved titles, tags, descriptions, chapters applied straight to the platform), and it tracks the three rank races — YouTube search, Google web, and Google AI Overview citations.
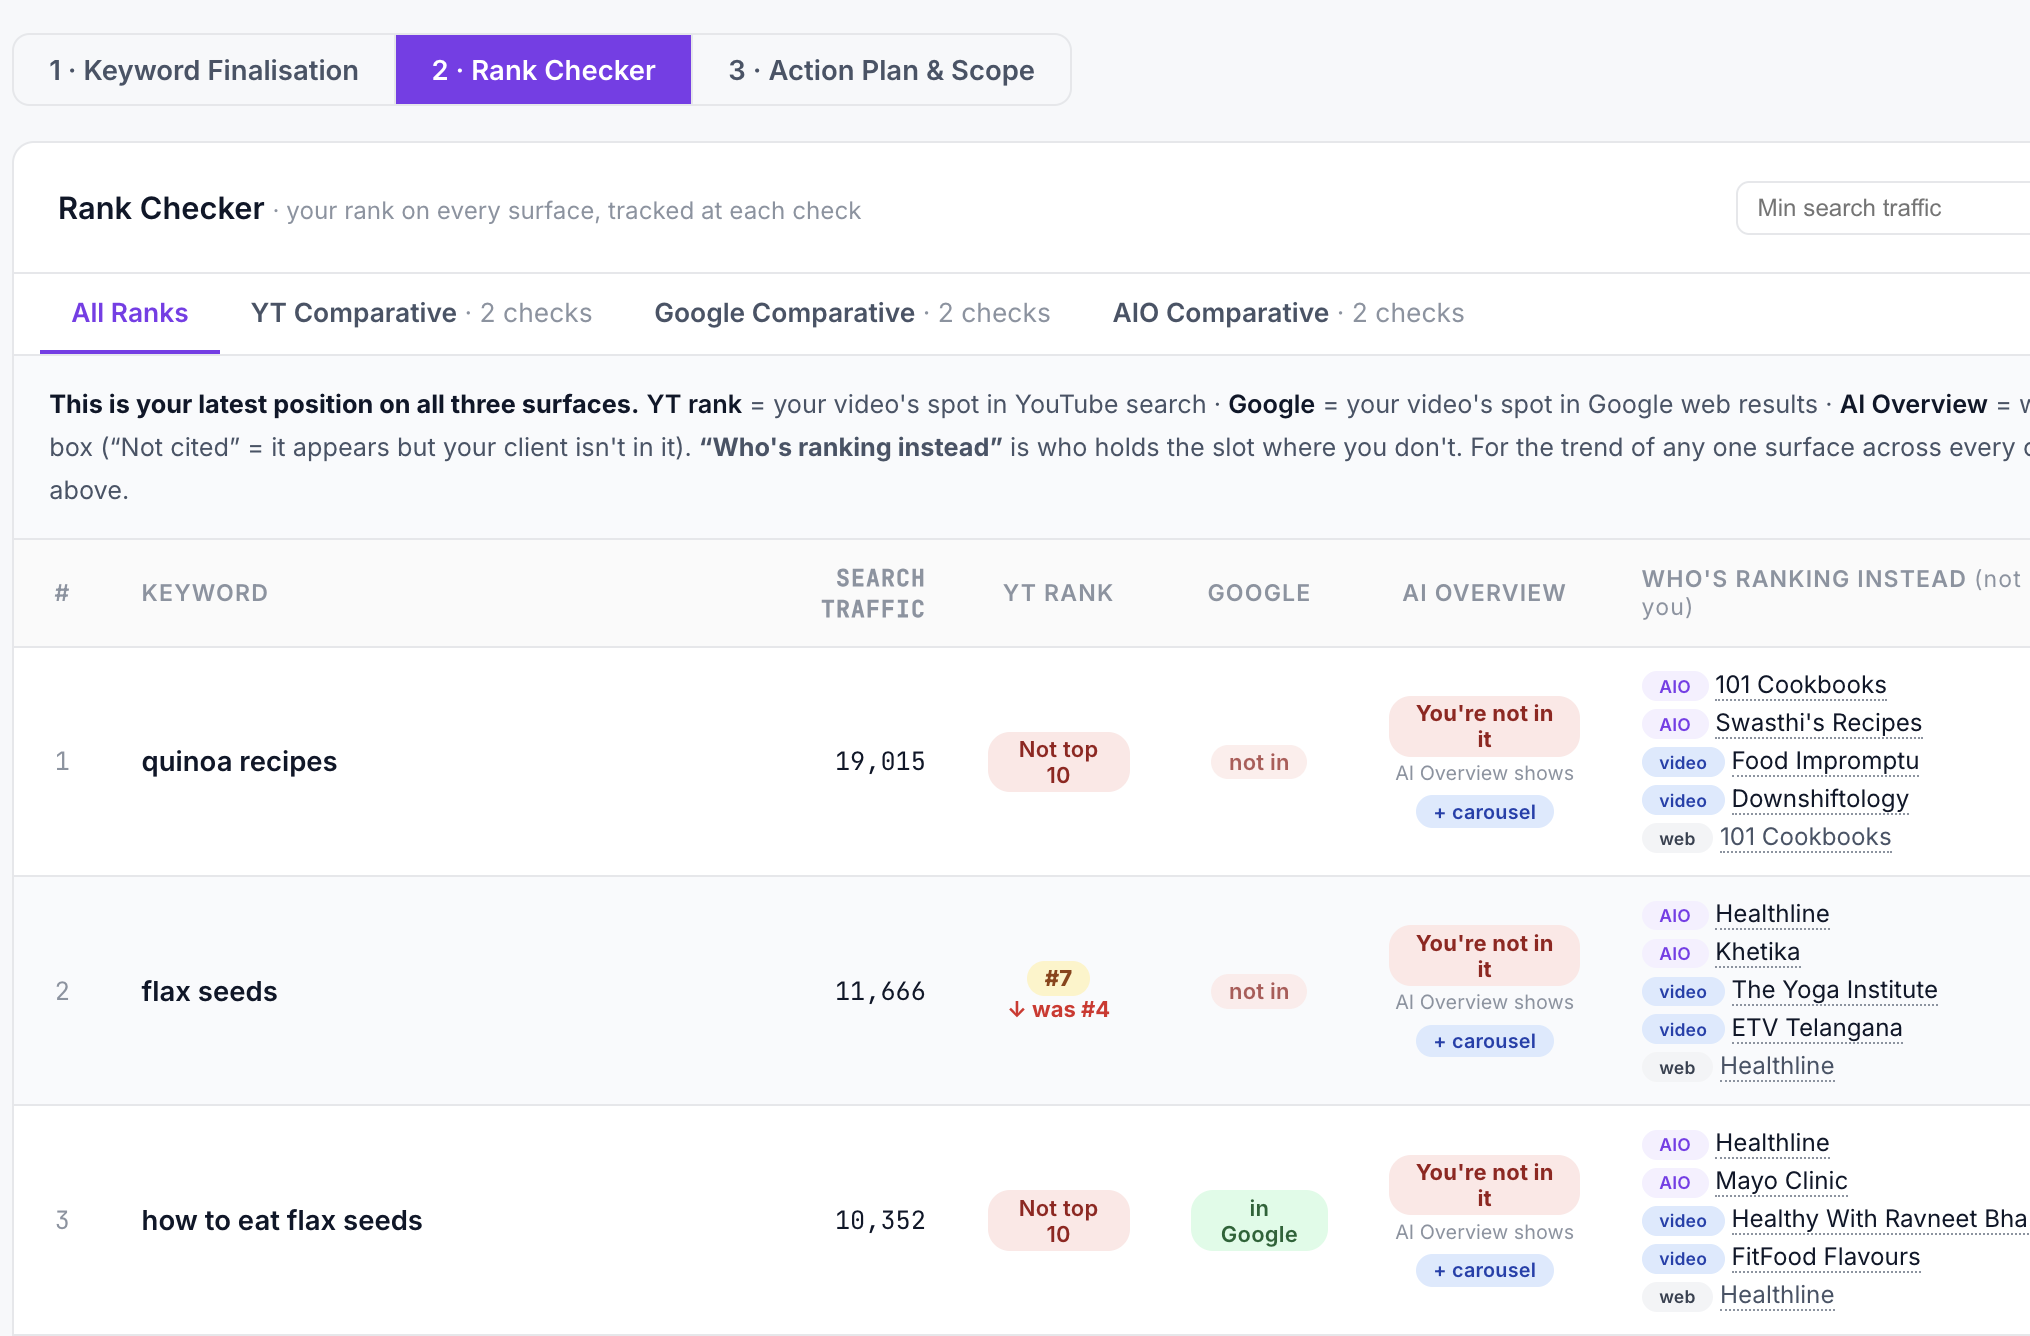
YODA runs the full 6-step workflow — Overview, Diagnostics, Strategy, Optimisation, Reputation (ORM), and Competitor Intel — with 40+ analysis modules organised under those steps. ICG's managed YouTube service uses YODA end-to-end. See the Healthcare YouTube Marketing pillar guide for the full scope, or the Healthcare YouTube Marketing Agency service page for engagement details.
Book a YODA demo on WhatsApp → or request a free healthcare YouTube channel audit →
Related reading
- Healthcare YouTube marketing pillar guide 2026
- YODA 6-step workflow explained for healthcare agencies
- Organic vs paid YouTube views for healthcare channels
- Best time to post on YouTube for healthcare in India 2026
- Healthcare YouTube marketing agency service page
FAQ
Are these benchmarks based on published external research? No. They reflect ICG's aggregate observations across healthcare channels managed through YODA and are directional. Public creator benchmark reports rarely segment healthcare specifically, which is why we publish these ranges — to give clinic teams a reference point that generic reports don't provide.
Do these bands vary by specialty (dermatology vs IVF vs multi-specialty hospital)? Yes, meaningfully. Dermatology channels typically sit higher on subscriber growth and comment velocity because the audience is broader. IVF channels sit higher on average view duration because viewers arrive with more considered intent. Multi-specialty hospital channels sit lower on comment velocity because they are perceived as institutional rather than personal. These are aggregate bands; specialty-specific bands are tighter.
Should I optimise for the 90th percentile on every axis? No. Simultaneous 90th percentile targets create conflicting priorities. Optimise for the 75th percentile across most axes and 90th percentile on the one or two axes most connected to your channel's current stage. New channels prioritise upload consistency and CTR; mature channels prioritise search discovery share and comment engagement.
How do paid campaigns affect these benchmarks? Every band above is organic-only. Blended paid+organic metrics inflate view-based numbers (subscriber growth appears faster) and distort quality metrics (average view duration blends paid-audience behaviour with organic). Strip paid before comparing to any benchmark in this guide.
What if my channel is significantly below the 25th percentile on multiple axes? Diagnose root cause before applying fixes. Multi-axis weakness usually reflects an upstream problem — poor topic selection, poor SEO, weak on-screen presence, or misaligned audience targeting — rather than the sum of independent tactical weaknesses. Fix the upstream cause and downstream metrics follow.
Do Shorts and long-form share the same benchmark bands? No. Shorts and long-form have entirely different distributions. This guide separates them in the retention section; for subscriber growth and comment velocity, Shorts benchmarks are 30% to 50% lower than long-form benchmarks on channels with mixed content.
How often should we re-check our channel against these benchmarks? Monthly for tactical benchmarks (CTR, retention, upload cadence). Quarterly for structural benchmarks (search discovery share, comment velocity). Annually for the specialty band updates as we re-calibrate.
What's the single most important benchmark for a channel under 12 months old? Upload consistency. Without consistency, no other benchmark is stable enough to measure meaningfully. Once consistency is at 75th percentile or better, retention and CTR benchmarks become the next priority.
Can we use these benchmarks to compare against a competitor channel? Directionally, yes, but competitor data is estimated (external tools infer view counts, retention, and subscriber flows imperfectly). Use benchmarks to compare your channel against the specialty distribution, not against a specific competitor's inferred numbers.
Do these benchmarks account for regional Indian language channels? Partially. Language-specific channels (Hindi, Tamil, Telugu, Marathi, Bengali) show different discovery patterns because the language audience is more concentrated and the competitive set is different. English-language healthcare channels serving pan-India audiences fit the bands more directly. Language-specific bands need their own calibration.
Book a free 30-minute Brand & Growth Diagnostic.
It's a working session, not a sales pitch — you leave with a written root-cause analysis you can act on, whether or not you engage ICG.
The three platforms
behind every ICG engagement.
Beacon
CAPI middleware that fixes Event Match Quality, translates CRM statuses to Meta-standard events, dedups across channels.
Agency OS
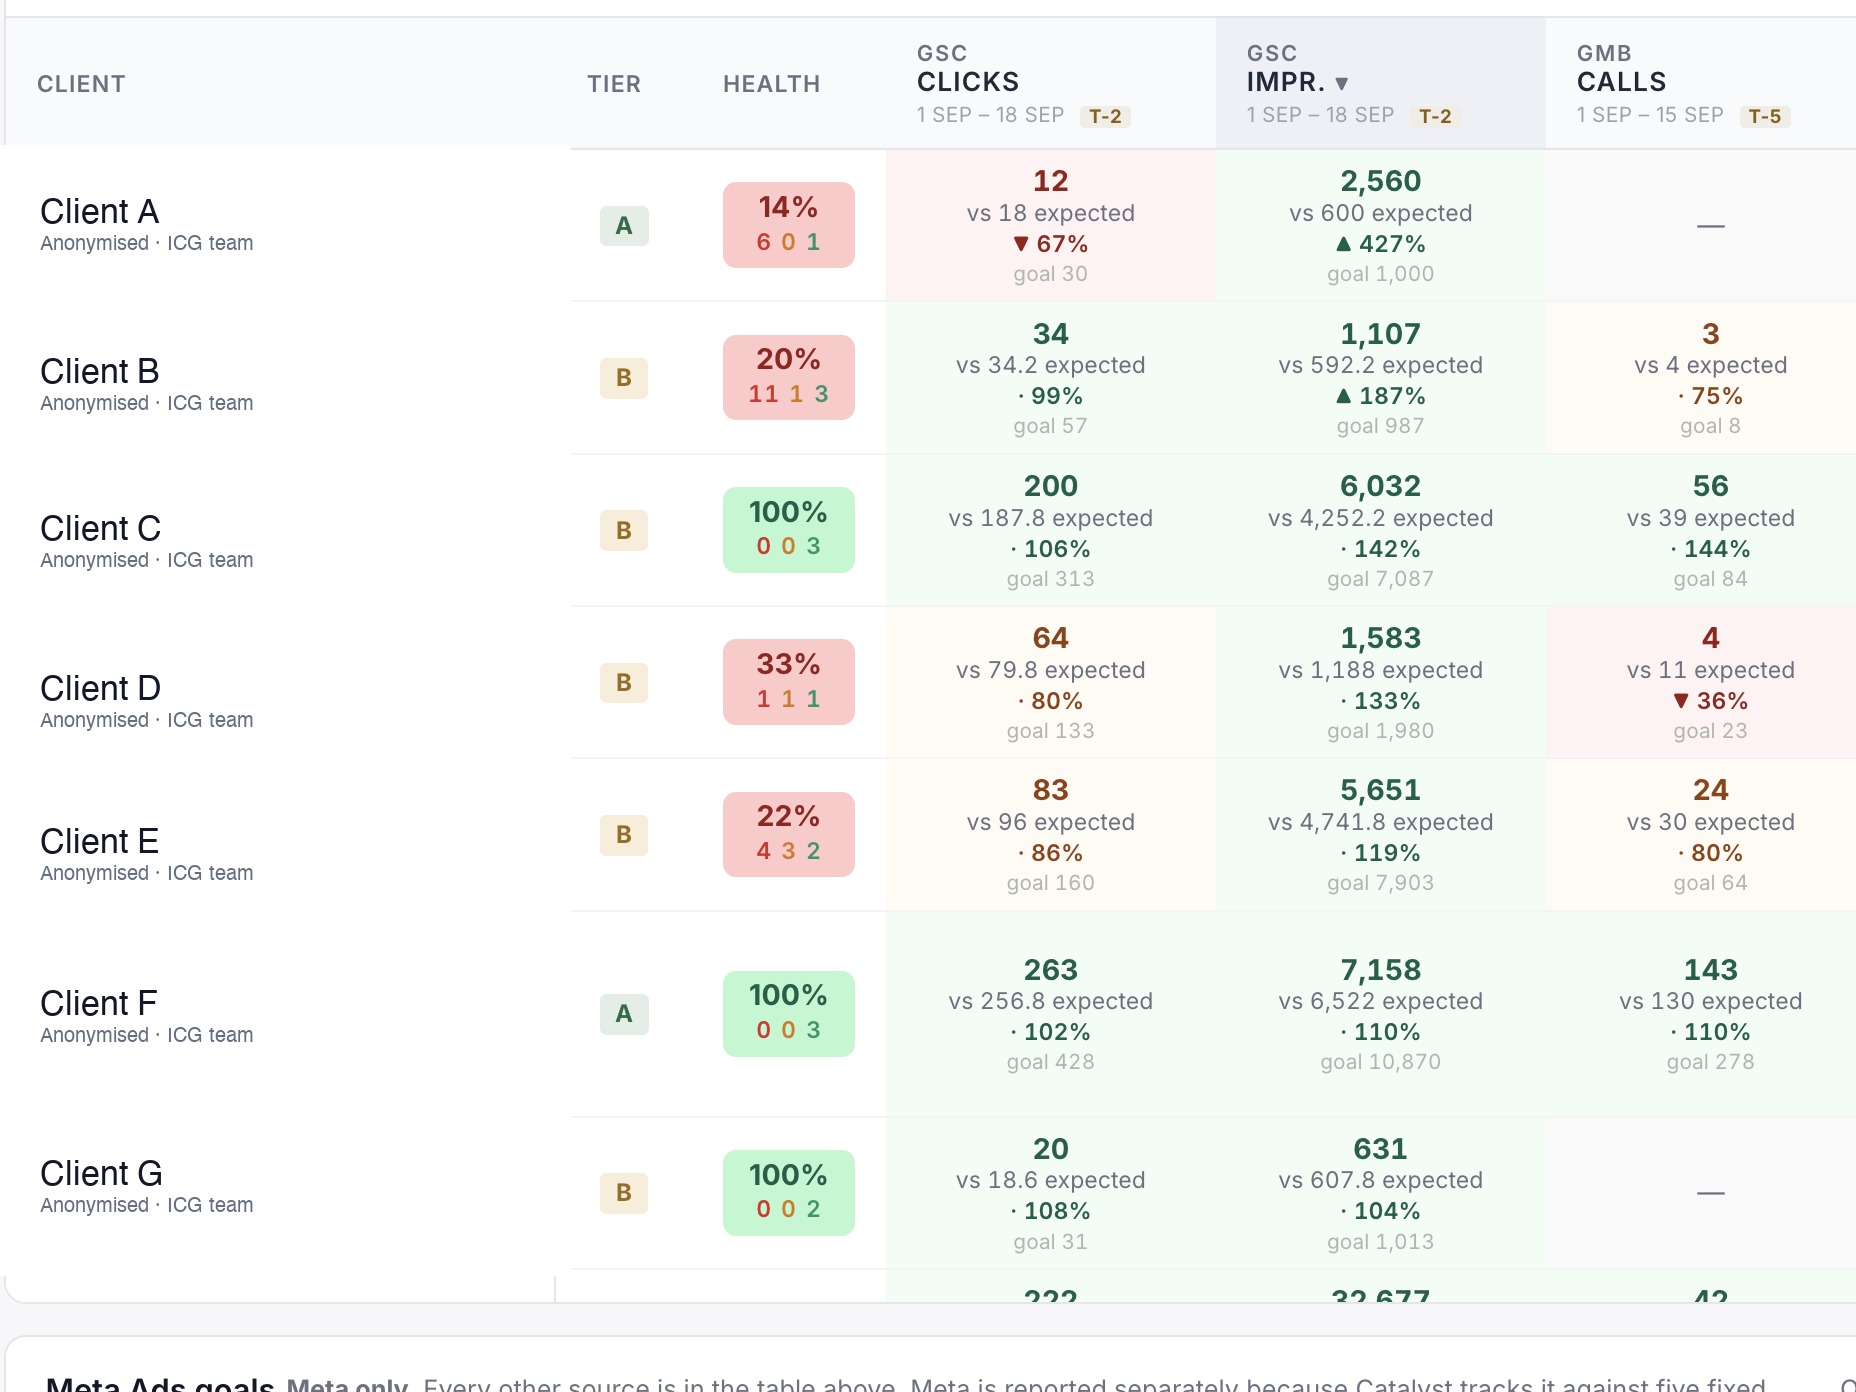
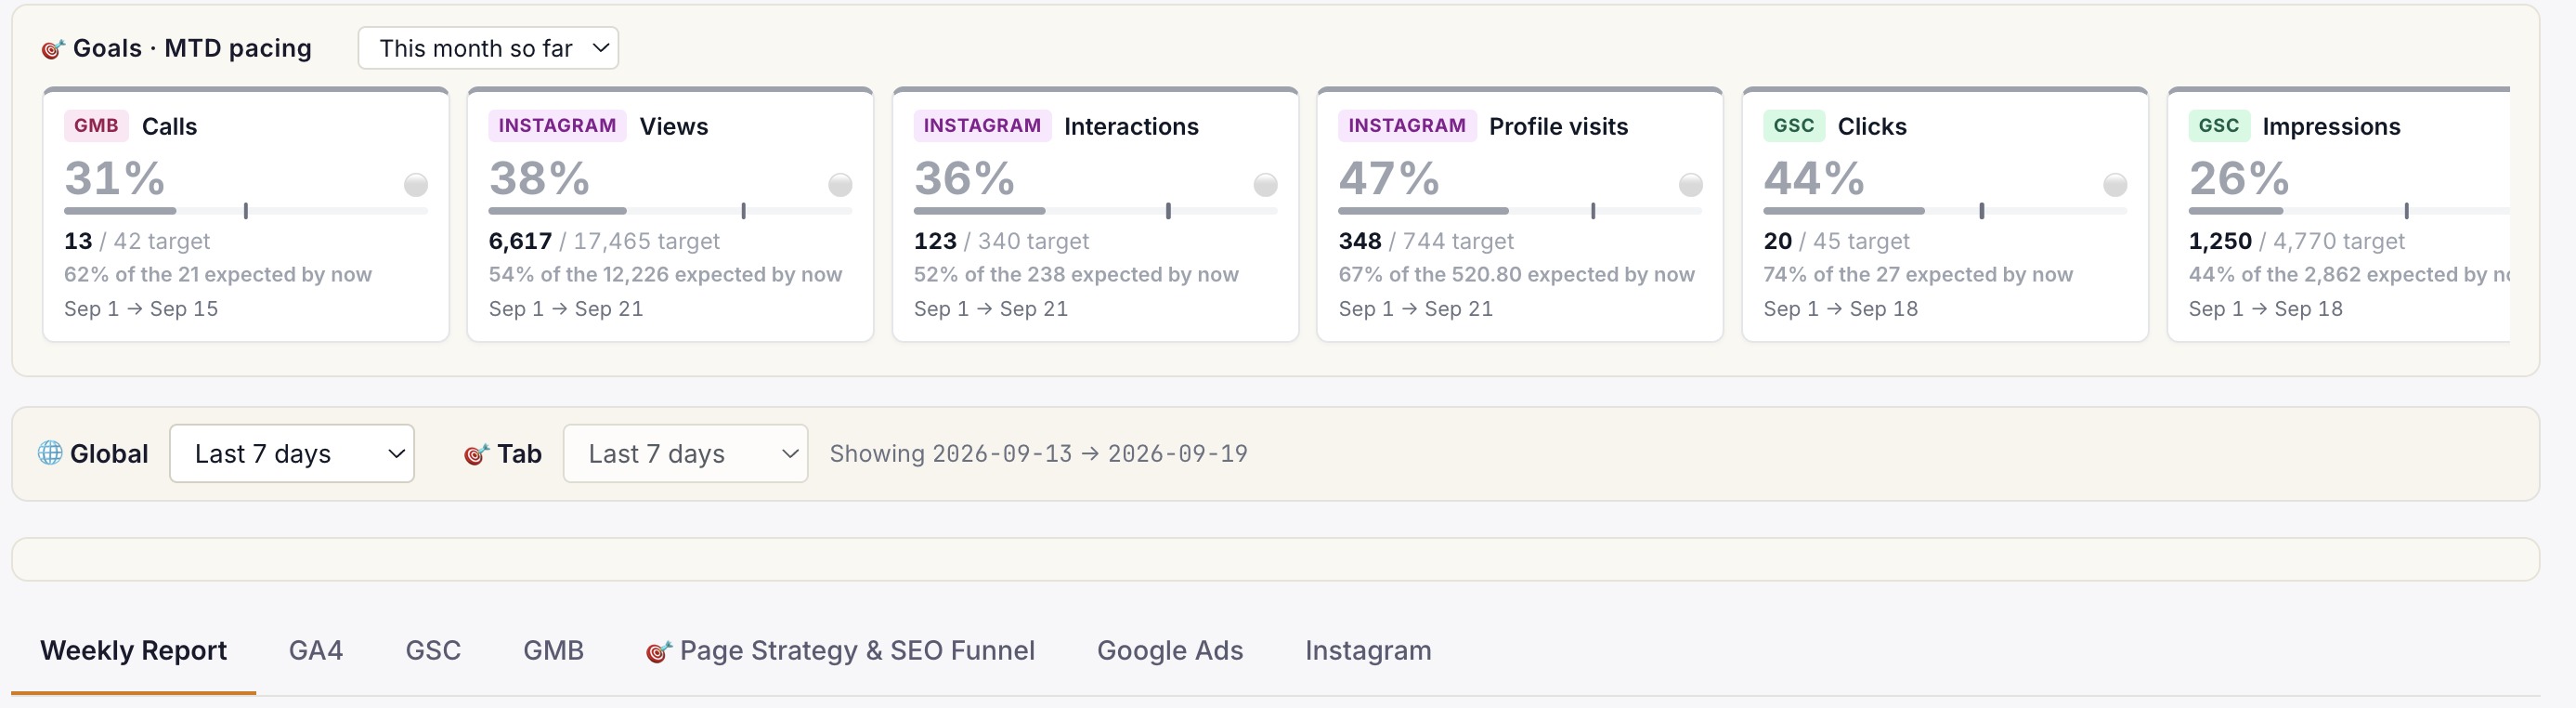
Live client dashboard. GSC, GA4, Google Ads, Meta Ads, IVR calls in one view. Login anytime, not monthly.
Phoenix
Clinic revenue intelligence over your PMS. Daily action queue: Prevent Loss, Maintain & Engage, Grow Revenue. Multi-centre rollout.
Or book a free 30-min audit to see all three in action on your account.
Healthcare brands
that already run on ICG.
A representative slice of the 150+ healthcare brands ICG has delivered for across India. Most engagements remain under NDA.


What ICG clients say · on video.
"Scale up of organic channels and business consulting. ICG has absolute domain authority in their field."
"Working with ICG transformed how we acquire IVF patients in Gurgaon. They understand the fertility journey from inquiry to consult..."
"What Ichelon accomplished — they got all my ideas and worked over 3-4 months to create an amazing, super-customised website."
Need help operationalising this?
Every ICG service is healthcare-only, NMC + DPDP-aware, and built around the patient-research patterns that drive Indian healthcare growth in 2026.
Every practice welcome — packages from ₹20,000/mo.
Goals-Driven engagements · Performance-Linked Payout Models available
More from
ICG.
Five trends shaping Indian healthcare marketing through 2027: AI-first patient research, Conversions API adoption, ABDM discovery, the AEO w...
Healthcare AIO is the discipline of getting your clinic or hospital cited inside Google AI Overviews, ChatGPT and Perplexity answers — not j...
Conversational-search advertising places brand messages inside AI chat answers — ChatGPT, Perplexity, Copilot — rather than beside a results...
Stop guessing.
Book a Diagnostic.
30 minutes. Free. With the AI-powered healthcare-only marketing agency 150+ brands already run on. No slides, no pitch, no hard close.


