


Who actually watches your clinic YouTube channel: the audience demographics that decide healthcare video strategy in India
The real audience for Indian healthcare YouTube channels — age brackets, gender split, geo distribution, device mix, watch-time behaviour — differs sharply by specialty. This guide covers how to read YODA's Audience module and sample audience patterns for dermatology, IVF and cardiology channels.
No pitch. Written root-cause diagnosis. AI-powered, healthcare only.
Direct answer
The real audience for Indian healthcare YouTube channels — age brackets, gender split, geo distribution, device mix, watch-time behaviour — differs sharply by specialty. This guide covers how to read YODA's Audience module and sample audience patterns for dermatology, IVF and car...
TL;DR

Who actually watches your clinic's YouTube channel is a question most Indian healthcare marketing teams have a vague theoretical answer to and no data-backed answer to, and the mismatch between assumed audience and real audience is the single biggest reason healthcare content underperforms. Dermatology channels assume they are speaking to 25-35 year old women; the real audience is often 45-55 year olds researching adult skin conditions. IVF channels assume the primary viewer is the female patient; the real audience is frequently the male partner and the extended family. Cardiology channels assume the patient is watching; the real audience is the patient's adult child. Getting this wrong shapes titles, thumbnails, script tone, and the entire content strategy in the wrong direction. ICG runs healthcare YouTube programmes for the clinics we support on local SEO and reputation, and reading the audience data honestly is the first thing we insist on before any content decisions get made.
Why audience assumptions are almost always wrong for healthcare channels
Healthcare content is different from lifestyle content in one specific structural way — the person searching for information about a health condition is often not the person who has the condition. Adult children search for parents, spouses search for spouses, extended family members search on behalf of relatives who are not digital-native, and the searcher's demographic profile diverges from the patient's demographic profile.
Add to this the general demographic slant of YouTube viewership in India, which skews younger, more male, and more urban than the general population, and the layered filter of who actually clicks on healthcare content within that platform base — and the resulting audience is almost never what the marketing team assumed based on intuition about the specialty.
The consequence: content written for the assumed audience misses the actual audience. A thumbnail designed for a 30-year-old woman fails to attract the 55-year-old man who is actually the primary viewer. A script tone calibrated to a first-time patient does not land with the family-member-doing-research viewer who is looking for very different information (severity, treatment options, second-opinion criteria) than the patient themselves might be.
The audience dimensions that actually matter for a healthcare channel
YouTube's Studio Analytics and the underlying YouTube Data API expose several audience dimensions. Six of them carry material weight for content decisions on a healthcare channel:
Age bracket distribution. YouTube reports viewership across standard age buckets. Healthcare channels typically show a wider distribution than lifestyle channels, and the mode is often surprising — often older than the specialty's target patient demographic.
Gender split. Reported as a percentage split. For most Indian healthcare channels the split skews meaningfully more male than the specialty's patient population would suggest, reflecting the family-member-searching pattern.
Geographic distribution. Country, state, and city level views. Healthcare channels for city-based clinics need to understand what fraction of viewership is coming from the clinic's catchment area versus the rest of India versus international diaspora — three fundamentally different audiences with different content demands.
Device mix. Mobile versus TV versus desktop. Indian healthcare viewership skews heavily mobile, with implications for thumbnail readability, text overlay size, and video length preferences.
Watch time and average view duration. Absolute watch time is a vanity number; average view duration as a percentage of video length is the retention signal that matters.
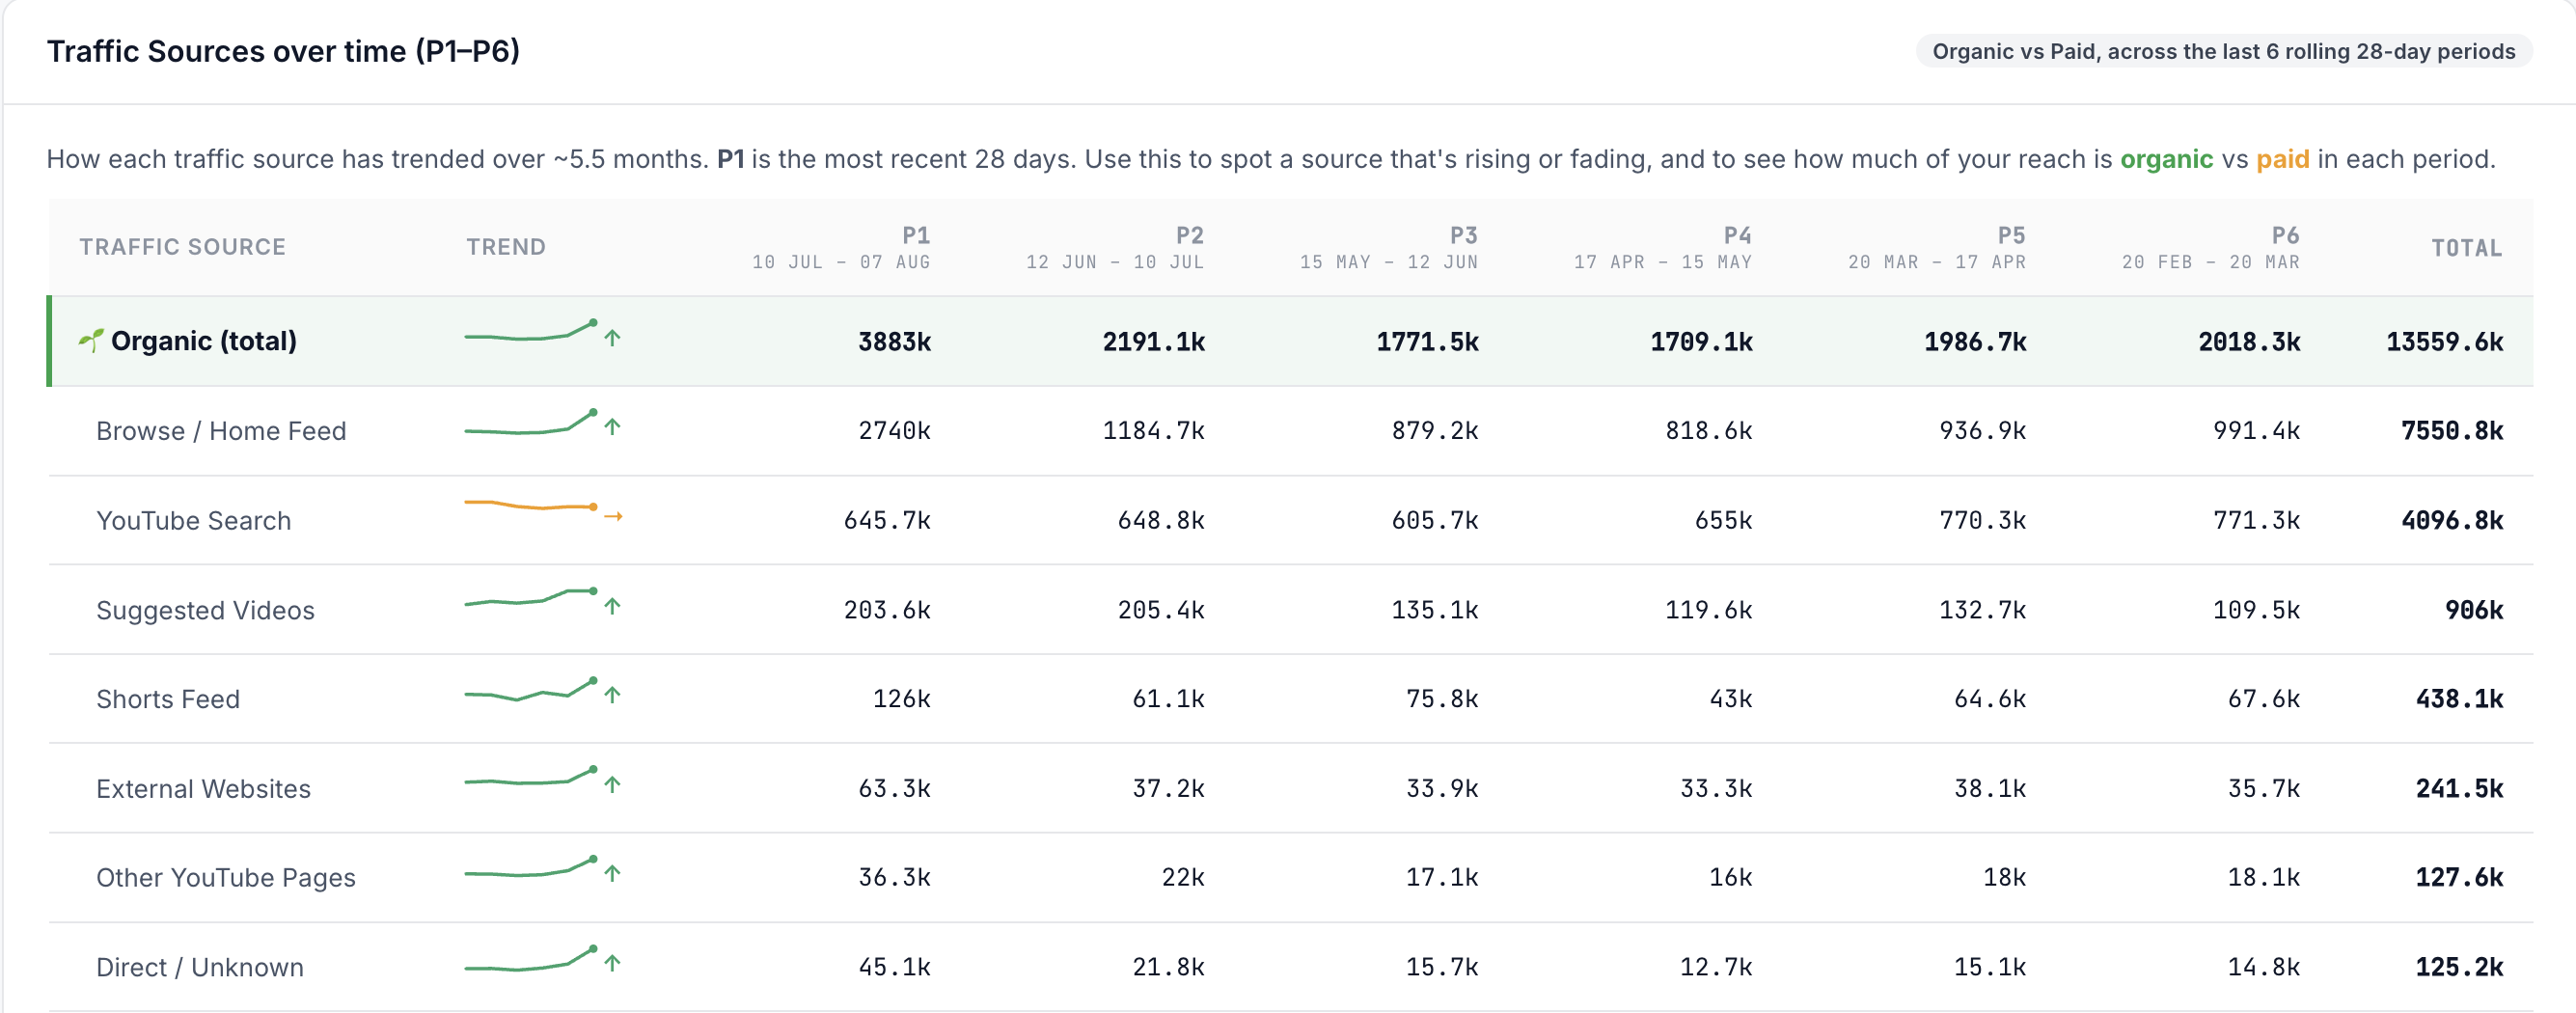
Traffic source. YouTube search, Suggested videos, Browse features, External, Playlists. The mix reveals whether the channel is being discovered actively (search-driven) or passively (suggested-driven), and each drives a different content prioritisation.
How to read YODA's Audience module without getting lost in noise
YODA's Reputation and Diagnostics steps include an Audience module that surfaces the six dimensions above with two features that raw YouTube Analytics does not offer: paid-view subtraction (so audience data reflects genuine organic reach rather than being distorted by promoted-video demographics), and demographic-benchmark comparison against ICG's healthcare-specialty corpus (so a channel's numbers get anchored against comparable channels rather than viewed in isolation).
Reading the module productively means starting with three questions and working from there. Question one — is my catchment-area audience share above or below the specialty baseline? For a Delhi dermatology clinic, YODA benchmarks show that healthy channels typically have 25-40% of viewership originating from within a 50km radius of the clinic. Channels below 15% are attracting too much national or diaspora viewership relative to local, which usually means the content is too generic and not city-anchored enough.
Question two — is my age distribution shifted from the specialty patient demographic in a predictable direction? A moderate shift older by 5-10 years is normal (family-member effect); a shift by 15+ years or a distribution that is bimodal often reveals an unmet content need for the older cohort that the channel is unintentionally over-serving.
Question three — is my mobile share above or below 85%? Indian healthcare YouTube viewing runs 85-95% mobile. Channels below that threshold either have content styled for desktop (too much on-screen text, thumbnails too complex) or have unusual audience composition worth investigating.
Sample audience report for a Delhi dermatology clinic channel
The pattern that emerges across the dermatology channels ICG manages — this is a composite illustrative sketch, not a specific client's data:
Age distribution: 18-24 = 12%; 25-34 = 24%; 35-44 = 22%; 45-54 = 20%; 55-64 = 14%; 65+ = 8%. The mode is 25-34 as expected, but the tail into 45-64 is substantial — driven by adult-skin-condition searches (rosacea, adult acne, pigmentation, hair loss) that the marketing team often under-serves in content planning.
Gender split: 42% female, 58% male. Male over-index reflects both the family-member-searching pattern and the hair-loss content category that skews heavily male. Channels that assume female-dominant audience and script content in feminine framing miss the majority of their actual audience.
Geographic distribution: 32% Delhi-NCR (catchment), 45% rest of India, 18% international (primarily US, UK, UAE diaspora), 5% other. Healthy split — the catchment share supports local business conversion; the national and diaspora shares support long-term brand building.
Device mix: 91% mobile, 6% desktop, 3% TV/other. Standard for Indian healthcare.
Traffic source: 38% YouTube search, 28% Suggested videos, 18% Browse features, 12% External (Google search, Facebook), 4% Playlists. Search-driven majority means content-market fit is decent; a channel with under 25% search share usually has SEO gaps.
Average view duration: 3:45 on 6-minute average video length = 62% retention. Healthy for the specialty.
Sample audience report for an IVF clinic channel
IVF channels show a distinctly different pattern — again illustrative:
Age distribution: 25-34 = 41%; 35-44 = 34%; 18-24 = 8%; 45-54 = 11%; rest = 6%. Concentrated in the treatment-relevant age brackets as expected, with a meaningful 35-44 secondary cohort that reflects both the treatment demographic itself and older family members researching on behalf of younger couples.
Gender split: 48% female, 52% male. Male share is high — often surprising to marketing teams — because male partners are heavily engaged in IVF research and decision-making. Content that speaks only to the female patient loses half the audience.
Geographic distribution: 22% clinic-city, 55% rest of India, 20% international diaspora (particularly Middle East and North America), 3% other. IVF has a heavier diaspora share than most specialties because Indian diaspora patients frequently travel to India for treatment; catchment share is correspondingly lower.
Device mix: 88% mobile, 8% desktop, 4% TV/other. Slightly higher desktop share than dermatology, consistent with more detailed research behaviour.
Traffic source: 44% YouTube search, 26% Suggested, 14% Browse, 12% External, 4% Playlists. Higher search share than dermatology reflects the deliberate research behaviour typical of the specialty.
Average view duration: 5:20 on 8-minute average = 66% retention. High engagement.
Sample audience report for a cardiology channel
Cardiology channels typically look like this:
Age distribution: 45-54 = 26%; 55-64 = 24%; 35-44 = 18%; 65+ = 15%; 25-34 = 12%; 18-24 = 5%. Concentrated in older brackets as would be expected for the specialty's patient population, though the 25-44 share is meaningful and reflects the adult-child-researching-for-parent pattern strongly.
Gender split: 38% female, 62% male. Male over-index is heavy — driven by cardiac disease's male-skewed epidemiology and by the male-family-member-researching pattern layered on top.
Geographic distribution: 26% catchment, 52% rest of India, 19% international diaspora, 3% other. Diaspora share is high because ageing NRI parents in India are frequently researched by children abroad.
Device mix: 82% mobile, 12% desktop, 6% TV/other. Higher TV share than most specialties, likely reflecting older-viewer TV-based YouTube consumption.
Traffic source: 40% Suggested, 32% YouTube search, 16% Browse, 8% External, 4% Playlists. Suggested-dominated traffic mix reflects the browse-heavy behaviour of older cohorts and channels with strong topic clustering that trigger YouTube's recommendation system.
Average view duration: 4:10 on 7-minute average = 60% retention. Slightly below the retention seen in more research-driven specialties like IVF, consistent with more casual viewing patterns of older cohorts.
What to change when the audience data tells you something you did not expect
The audience report is only useful if it changes content decisions. The specific decisions the data should drive:
Thumbnail composition. If the actual viewer is 15 years older than the assumed viewer, redesign thumbnails to feature age-appropriate on-camera talent and text sizes that read on smaller mobile viewports. Older viewers need larger text and higher contrast.
Script tone and vocabulary. Family-member viewers ask different questions than patient viewers — "how bad is this", "does dad need surgery", "what are the second opinion criteria". Scripts should include content aimed at family-decision-support framings, not only patient-first framings.
Language and regional accent. If catchment share is high, Hindi or the relevant regional language versions of top-performing videos will materially expand local audience. If diaspora share is meaningful, English-first content with Indian context retains the diaspora audience better than fully Indianised content.
Video length. Higher retention specialties tolerate longer videos; lower retention specialties benefit from shorter, more focused content. IVF audiences will watch 12-minute deep dives; cardiology audiences typically peak retention around 5-8 minutes.
Playlist and chapter strategy. Suggested-dominated traffic mixes benefit from tight topical clustering — playlist grouping and chapter markers help YouTube's recommendation engine understand the topic authority.
What to do with audience data you should not act on directly
Not every audience insight is actionable. Some patterns are structural to the specialty (male-skewed cardiology audience reflects epidemiology; there is no content strategy that will flip it) or to the platform (mobile-dominant viewership is not going to change). Some patterns are noise from small sample sizes — a channel with 500 monthly views has audience data that fluctuates weekly and should not be over-interpreted.
The rule that separates signal from noise: an audience data point is worth acting on when it (1) contradicts a specific assumption the content team was making, (2) has stabilised over at least 60 days, and (3) has a clear content-decision implication. Everything else is context to keep in mind, not a decision input.
The platform ICG uses to run this at scale: YODA
ICG runs healthcare YouTube marketing for clinics, hospitals, and specialty groups using YODA — our AI-native healthcare YouTube marketing platform. YODA sits on top of a channel's data and does four things no dashboard does: it separates organic from paid views at every step (so a promoted video can never masquerade as organic growth), it gives decisions not dashboards (every video gets a state + next action), it writes back to YouTube directly (improved titles, tags, descriptions, chapters applied straight to the platform), and it tracks the three rank races — YouTube search, Google web, and Google AI Overview citations.
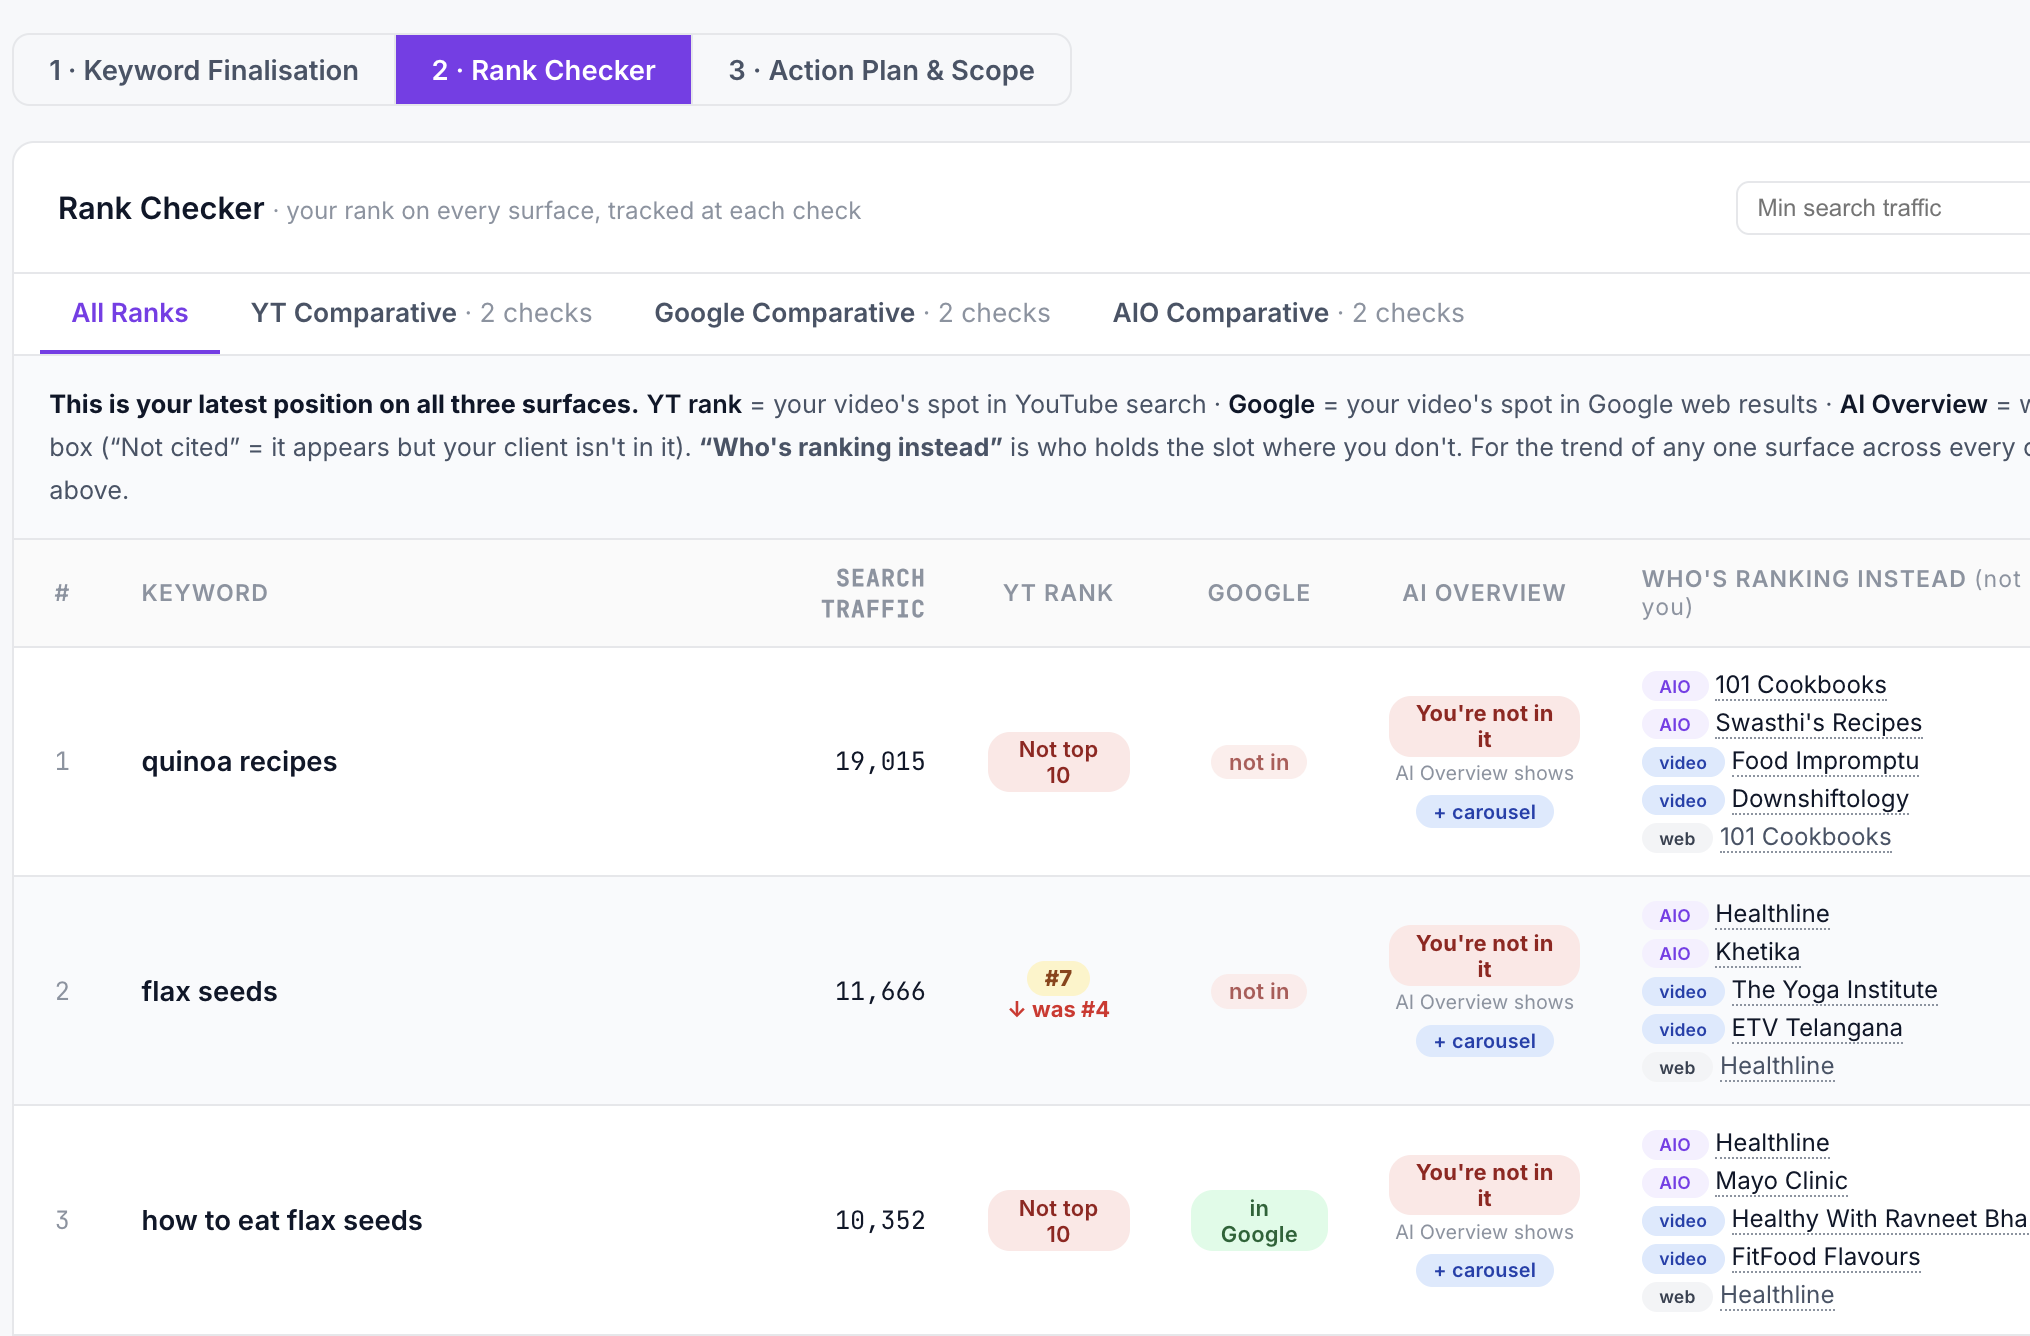
YODA runs the full 6-step workflow — Overview, Diagnostics, Strategy, Optimisation, Reputation (ORM), and Competitor Intel — with 40+ analysis modules organised under those steps. ICG's managed YouTube service uses YODA end-to-end. See the Healthcare YouTube Marketing pillar guide for the full scope, or the Healthcare YouTube Marketing Agency service page for engagement details.
Book a YODA demo on WhatsApp → or request a free healthcare YouTube channel audit →
Related reading
- Healthcare YouTube marketing pillar guide 2026
- Patient trust and YouTube E-E-A-T for Indian healthcare
- YouTube views versus revenue: the numbers that actually matter
- Best time to post on YouTube for Indian healthcare in 2026
- Healthcare YouTube marketing agency service page
FAQ
How much audience data does a channel need before the numbers are meaningful? Roughly 5,000 to 10,000 monthly views before the demographic and geographic splits are stable enough to base content decisions on. Below that threshold the numbers are directionally interesting but individual data points can flip week to week.
Does YouTube's reported demographic data include viewers who are not logged in? Partly. YouTube reports demographics only for viewers signed in to a Google account with demographic data — typically 40-60% of the total viewership. The reported splits are inferred to be representative of the full audience but the sample skews slightly toward more engaged viewers.
Can we get city-level audience data or only state-level? YouTube Studio surfaces country and top-city breakdowns for larger channels but state-level and long-tail city data is often aggregated. The YouTube Data API exposes finer detail than the Studio UI for channels that pull data directly. YODA pulls at the finest available granularity and normalises across specialty.
How does the diaspora audience share affect content strategy? Meaningfully. Diaspora viewers usually want India-centric medical context (specific medications available in India, insurance framing for Indian insurers, cost expressed in rupees) plus reassurance about clinical standards versus their country of residence. Content that ignores diaspora needs loses that audience over time.
Should we localise content for regional languages based on geographic audience data? Yes, for the top 1-2 regional languages that show up in the geographic split. Publishing every video in three languages is over-investment for most channels; publishing top-performing evergreen videos in the primary regional language of the catchment is a strong ROI move.
Do audience patterns change over the course of a year? Yes — seasonal patterns matter in some specialties (respiratory in winter, dermatology in summer, pediatric in school-holiday clusters). Watch the audience data across a full year before drawing structural conclusions.
What is the fastest way to expand catchment-area audience share on a channel that skews national? City-anchored content and playlists that name the catchment city in titles, descriptions, and thumbnails. Google and YouTube both use these signals to elevate the channel for local queries even when the underlying content is generalisable.
How reliable are the paid-view subtraction figures YODA provides? YODA identifies paid views by cross-referencing the YouTube Ads reporting APIs with the organic viewership feed. The subtraction is accurate at the video level for campaigns run through the connected Google Ads account. Outside-platform promotion (paid influencer mentions, cross-channel promo) needs manual tagging in YODA to be excluded.
What audience data should we not share with the presenting clinician team? Nothing — the transparency helps clinicians calibrate their content. What should be avoided is over-reacting to short-term audience shifts before they stabilise. Present rolling 90-day windows, not single-week snapshots.
Does audience data correlate with actual consultation bookings from the channel? Directionally yes but the correlation is not tight — audience quality (search-driven, catchment-area, treatment-decision-stage viewers) matters more than raw audience size. YODA's attribution workflow ties channel data to booking data through UTM-tagged description links, which is the closest to a genuine correlation view most channels can build.
Book a free 30-minute Brand & Growth Diagnostic.
It's a working session, not a sales pitch — you leave with a written root-cause analysis you can act on, whether or not you engage ICG.
The three platforms
behind every ICG engagement.
Beacon
CAPI middleware that fixes Event Match Quality, translates CRM statuses to Meta-standard events, dedups across channels.
Agency OS
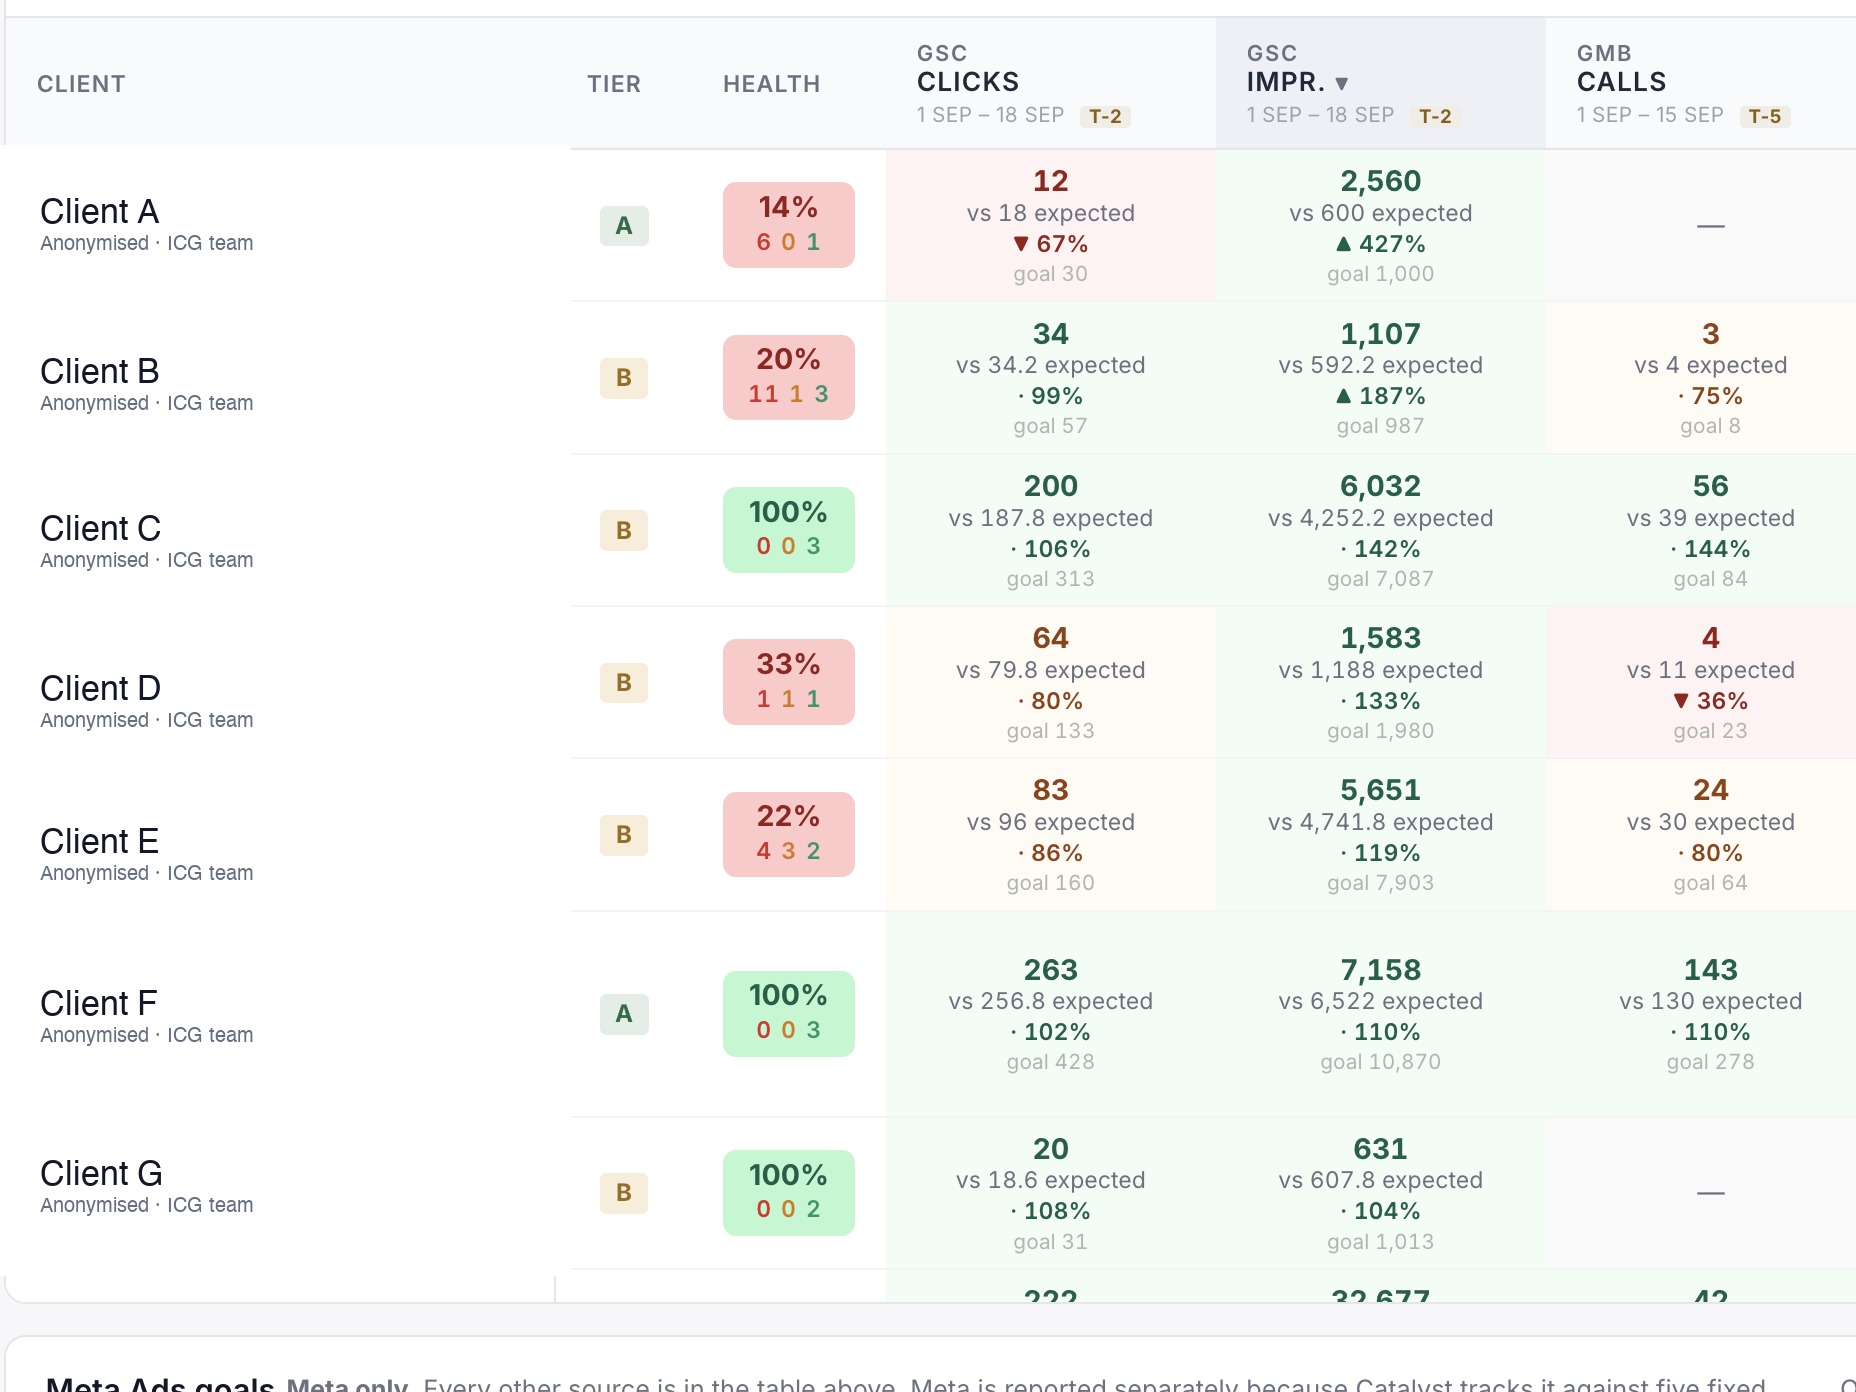
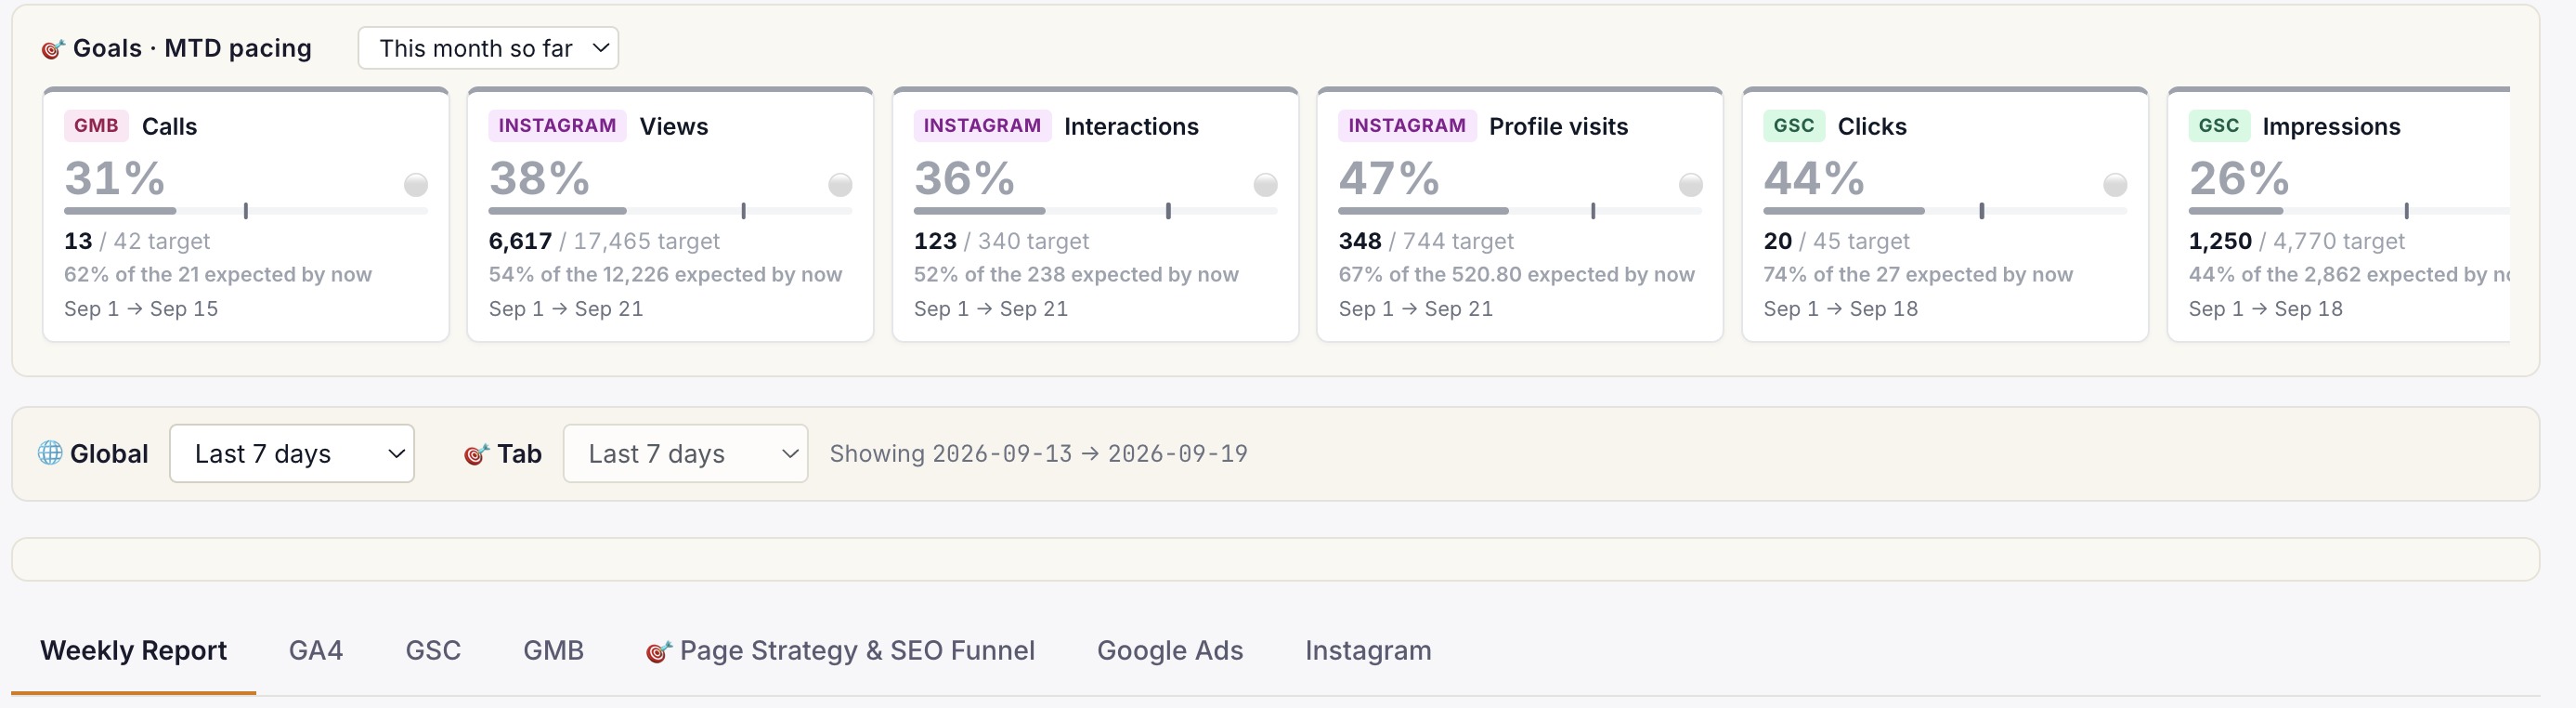
Live client dashboard. GSC, GA4, Google Ads, Meta Ads, IVR calls in one view. Login anytime, not monthly.
Phoenix
Clinic revenue intelligence over your PMS. Daily action queue: Prevent Loss, Maintain & Engage, Grow Revenue. Multi-centre rollout.
Or book a free 30-min audit to see all three in action on your account.
Healthcare brands
that already run on ICG.
A representative slice of the 150+ healthcare brands ICG has delivered for across India. Most engagements remain under NDA.


What ICG clients say · on video.
"Scale up of organic channels and business consulting. ICG has absolute domain authority in their field."
"Working with ICG transformed how we acquire IVF patients in Gurgaon. They understand the fertility journey from inquiry to consult..."
"What Ichelon accomplished — they got all my ideas and worked over 3-4 months to create an amazing, super-customised website."
Need help operationalising this?
Every ICG service is healthcare-only, NMC + DPDP-aware, and built around the patient-research patterns that drive Indian healthcare growth in 2026.
Every practice welcome — packages from ₹20,000/mo.
Goals-Driven engagements · Performance-Linked Payout Models available
More from
ICG.
Five trends shaping Indian healthcare marketing through 2027: AI-first patient research, Conversions API adoption, ABDM discovery, the AEO w...
Healthcare AIO is the discipline of getting your clinic or hospital cited inside Google AI Overviews, ChatGPT and Perplexity answers — not j...
Conversational-search advertising places brand messages inside AI chat answers — ChatGPT, Perplexity, Copilot — rather than beside a results...
Stop guessing.
Book a Diagnostic.
30 minutes. Free. With the AI-powered healthcare-only marketing agency 150+ brands already run on. No slides, no pitch, no hard close.


