


State of Doctor YouTube in India 2026: growth, retention, CTR, AI Overview citation rates and compliance patterns across ~150 healthcare channels
A landmark data study from ICG's YODA operations team, drawing on aggregate observations across roughly 150 healthcare YouTube channels managed and monitored through 2025 and 2026. Findings cover organic subscriber growth by specialty, thumbnail CTR and retention percentile bands, the organic-versus-paid contribution most channels never disclose, Google AI Overview citation rates for doctor content, comment sentiment and reputation patterns, viewer geography and device mix, common NMC/ASCI/DPDP/PC-PNDT/ART Act compliance failure patterns, and what separates top-decile healthcare channels from the median. All numbers are presented as ranges, sourced from ICG operational aggregate observations, and are not peer-reviewed research.
No pitch. Written root-cause diagnosis. AI-powered, healthcare only.
Direct answer
A landmark data study from ICG's YODA operations team, drawing on aggregate observations across roughly 150 healthcare YouTube channels managed and monitored through 2025 and 2026. Findings cover organic subscriber growth by specialty, thumbnail CTR and retention percentile bands...
TL;DR
Doctor YouTube in India in 2026 is not a single market. It is at least eight loosely-connected markets separated by specialty, city tier, language, format, and paid-versus-organic strategy — and aggregate reports that treat "healthcare YouTube" as one category systematically mislead the clinics, hospital groups, and marketing directors who have to make investment decisions against those numbers. This data study is ICG's operational aggregate view of the state of doctor YouTube in India in 2026, drawn from roughly 150 healthcare channels that ICG's YODA operations team manages, audits, or monitors as part of competitor intelligence work for managed clients. It covers organic subscriber growth by specialty, thumbnail CTR and retention percentile bands, the organic-versus-paid split most reports quietly omit, Google AI Overview citation rates for healthcare content, comment sentiment and ORM patterns, audience geography and device mix, the compliance failure patterns healthcare channels most often trip on, what separates top-decile channels from the median, and a compact set of predictions for 2027. Every number is presented as a range because operational aggregate observations do not warrant point-estimate precision. If this study's findings help calibrate your channel or your agency's advice, that is what it is designed to do. It is not, and does not claim to be, peer-reviewed research.
 yoda/14-comment-analysis.png" alt="YODA Comment Analysis — comment sentiment, question mining, competitor mentions from every video" loading="lazy" decoding="async" style="width:100%;height:auto;display:block;">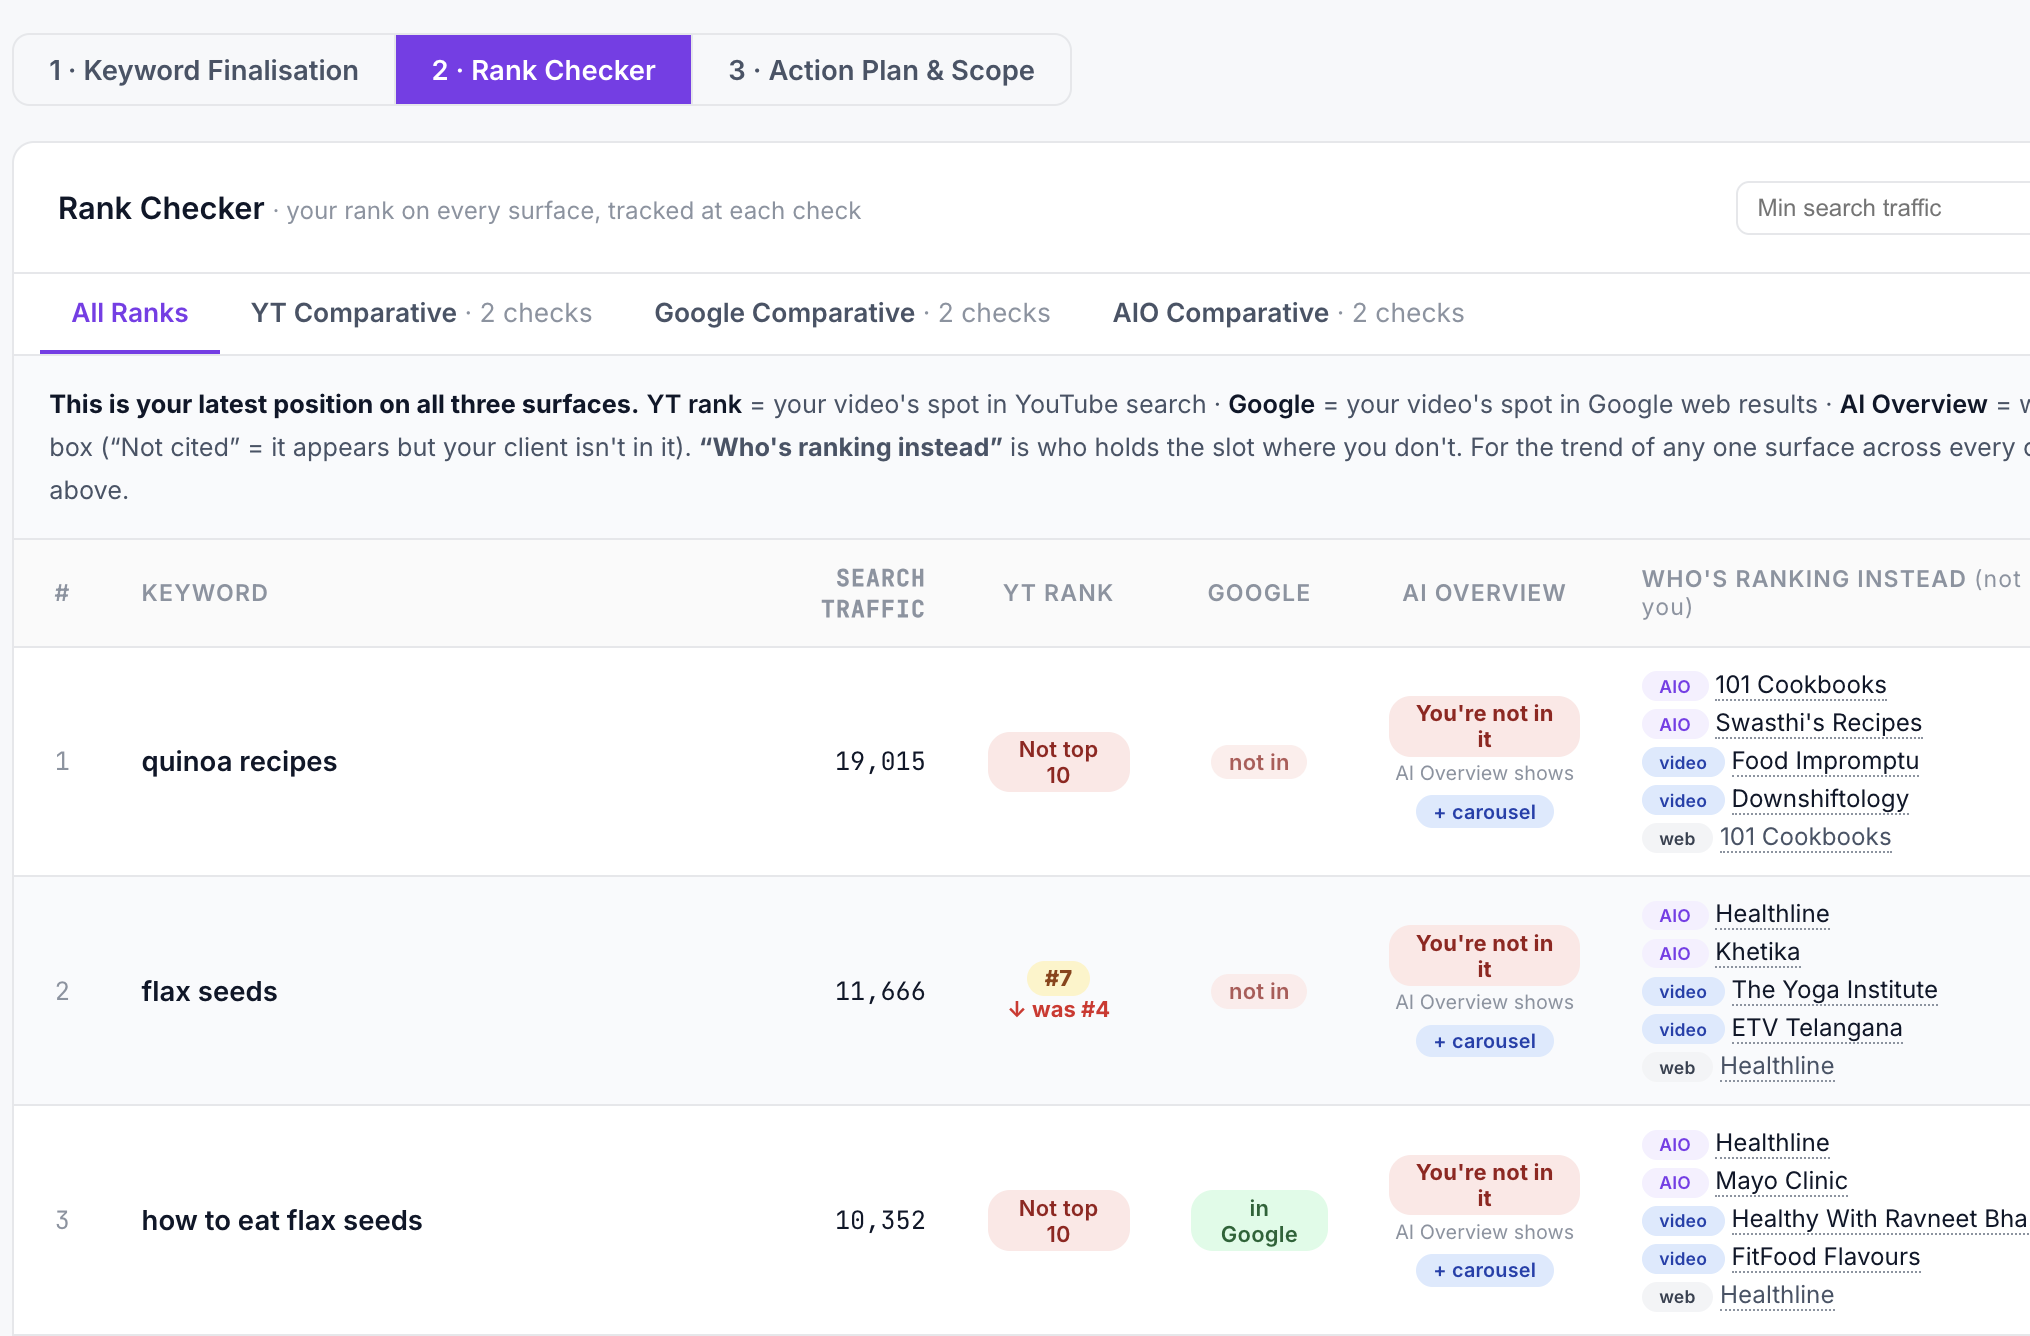
Executive summary: the six-bullet headline for 2026
Six findings anchor everything else in this study. Each is defensible from ICG's operational observations across roughly 150 healthcare YouTube channels through 2025 and 2026, and each is presented at the level of confidence the underlying data actually supports.
- Organic subscriber growth is slower than most healthcare marketing teams think it should be — and that is fine. Well-run Indian healthcare channels between 500 and 25,000 subscribers grow at roughly 6% to 12% month-over-month on organic activity. Sub-3% MoM signals a systemic problem. Above 20% MoM is rare and usually reflects a specialty-driven demand spike layered on strong prior coverage, not a repeatable playbook.
- Thumbnail CTR for healthcare content is materially lower than the platform-wide average, and healthcare marketing teams routinely misread this as failure. Median CTR for healthcare channels lands in the 3.5% to 4.5% band; platform-wide medians sit at 5% to 8%. Healthcare retention compensates — absolute watch time per impression is competitive with entertainment content once the click happens.
- Paid promotion contributes 30% to 55% of total views on channels that use it — and that contribution is routinely mistaken for organic growth. Channels with paid views stripped out are often one-quarter to one-half of their reported size. This is the single most common measurement error healthcare marketing teams make about their own channels.
- Google AI Overview cites healthcare YouTube content for roughly 8% to 15% of primary specialty queries in 2026, up sharply from near-zero at the start of 2025. AI Overview citation correlates with structured chapters, factual density, and E-E-A-T signals — subscriber count is a weak predictor. Small, well-structured channels are earning citations larger, sloppier channels are missing.
- Comment sentiment on Indian healthcare channels is roughly 60% to 75% positive, 15% to 25% neutral, 5% to 12% negative, and 3% to 8% spam. The negative slice is disproportionately visible in search snippets and disproportionately dangerous for reputation if a specific comment sits unaddressed past a 72-hour window.
- Roughly one in three healthcare channels ICG audits carries at least one clear compliance exposure — most often ASCI substantiation gaps, NMC patient-identification issues, DPDP consent gaps in patient-featuring content, PC-PNDT-adjacent language on fertility channels, or ART Act success-rate claims that no evidence supports.
Each finding is unpacked with specialty breakdowns, percentile bands, and operational context in the sections that follow.
Methodology: what "ICG operational aggregate" means and does not mean
This study is not peer-reviewed research. It is an operational aggregate — the pattern ICG's YODA operations team observes across the healthcare YouTube channels ICG actively manages, actively audits during onboarding, or passively monitors through public data as part of competitor intelligence work for managed clients. Framing this carefully matters, because a marketing team relying on these numbers is entitled to know what they are and are not.
The observation base across 2025 and 2026 is approximately 150 healthcare channels. Solo doctors make up roughly half the base, multi-doctor clinics roughly a quarter, specialty hospitals roughly a fifth, and diagnostic labs plus a small residual of others make up the remainder. Specialty distribution over-represents dermatology, IVF/fertility, dental, and cardiology because those are the specialties most active on YouTube in India; ophthalmology, orthopaedics, gastroenterology, and psychiatry are represented at smaller sample sizes and the study flags where a specialty-specific claim is drawn from a thinner slice.
Numbers throughout are presented as ranges — 25th to 90th percentile bands, "typical band", "median falls between A and B", "roughly X to Y". This framing is deliberate. Point estimates from an operational aggregate would imply precision the underlying data does not have. A range that a competent healthcare marketing team can calibrate their own channel against is more useful than a false-precision single number.
Where a claim depends on data ICG does not directly collect — Google AI Overview citation rates being the clearest example — the study says so. Where a claim depends on a subset (organic-vs-paid separation requires ad-account access, so it is drawn from ICG-managed channels only), the study flags the smaller sample. Where the specialty sample is thin, the study flags it in place. If you are making a nine-figure investment decision on the back of these numbers, commission your own primary research. If you are calibrating whether your channel broadly performs in line with the Indian healthcare YouTube market in 2026, this study is a useful reference.
Section 1: Channel growth benchmarks by specialty and channel maturity
Subscriber growth is the number healthcare marketing teams cite most, benchmark against most poorly, and misunderstand most systematically. Growth is expressed here as month-over-month percentage change on organic activity only, with subscribers acquired through paid promotion subtracted before the calculation. Numbers cover channels between 500 and 25,000 subscribers; larger channels grow more slowly in percentage terms simply because the base is bigger, and smaller channels are too volatile for percentile bands to be meaningful.
Across the full observation base, organic MoM subscriber growth for well-run Indian healthcare channels sits in these bands: 25th percentile 2%, 50th percentile 8%, 75th percentile 15%, 90th percentile 25% or above. Below 2% signals structural weakness on content quality, topic selection, upload cadence, SEO, or a combination. The 50th percentile — 8% MoM compounded — takes a 1,000-subscriber channel to roughly 2,500 subscribers in twelve months, which is unglamorous compounding but real compounding.
Specialty variation is significant. This ASCII chart shows the median (50th percentile) MoM organic subscriber growth band for the eight specialties in the observation base:
Specialty            Median MoM band     Sample size
Dermatology          ████████░░░░  8-14%     Large (~35 channels)
IVF/Fertility        █████░░░░░░░  5-10%     Large (~28 channels)
Dental               ███████░░░░░  7-13%     Large (~25 channels)
Cardiology           ████░░░░░░░░  3-6%      Medium (~18 channels)
Orthopaedics         █████░░░░░░░  4-8%      Medium (~15 channels)
Ophthalmology        ████░░░░░░░░  3-7%      Small (~10 channels)
Gastroenterology     ████░░░░░░░░  3-6%      Small (~8 channels)
Multi-specialty      ██████░░░░░░  5-9%      Medium (~11 channels)
Dermatology and dental sit at the top because their query volumes are high, viewer intent is educational rather than emergency, and treatment consideration windows are long — patients research over weeks and subscribe to channels that answer follow-up questions. IVF/fertility runs slightly behind despite comparable query volumes because a meaningful share of viewers are single-decision watchers who research one procedure, book (or don't book), and never return; subscriber conversion trails watch demand.
Cardiology, orthopaedics, and gastroenterology sit lower because their query volume is more emergency-driven (patients search when a problem is acute, absorb information, and don't typically subscribe to keep watching), and because content that would drive subscribers frequently crosses into clinical-advice territory the NMC Ethics Code discourages doctors from publishing without qualification.
Upload consistency is a stronger predictor of growth than any single-video quality signal. Channels publishing on a predictable weekly or twice-weekly cadence for six or more months show median MoM growth roughly 1.5x to 2x that of channels publishing at random intervals with the same total video count. YouTube's algorithm rewards session-watch-time compounding, and consistent cadence produces compounding.
Maturity matters more than most healthcare marketing teams account for. Channels under six months and under 1,000 subscribers show growth-rate volatility that percentile bands don't capture well — a single video going moderately well can lift a small channel's MoM to 40% or 50% for a month, then drop back. Bands become meaningful once the channel has 12+ months of history and 20+ published videos. Marketing teams reporting growth on brand-new channels should quote both MoM and absolute subscriber add — the absolute number is more honest at small scale.
View growth patterns track subscriber growth loosely but not tightly. Organic view growth typically outpaces subscriber growth by a factor of roughly 1.5x to 3x for well-run channels — a channel growing 10% MoM in subscribers usually grows 15% to 30% MoM in views. The gap widens for channels with strong SEO (search-driven views compound faster than subscriber-driven views) and narrows for channels dependent on subscriber-base repeat viewership.
Section 2: Thumbnail CTR benchmarks and what actually earns clicks
Thumbnail click-through rate is the single metric where healthcare marketing teams most consistently benchmark against the wrong reference. Public creator benchmarks — the ones frequently cited from vidIQ, TubeBuddy, or generic industry surveys — aggregate across gaming, lifestyle, entertainment, and product review channels where thumbnails can use the sensationalist visual grammar healthcare content is discouraged from using under NMC ethics guidelines. Healthcare thumbnails are constrained: no shock faces, no oversized dramatic text, no colour saturation that reads as clickbait, no unsubstantiated efficacy claims in text overlays.
Median CTR for healthcare channels in India lands in the 3.5% to 4.5% band. Platform-wide medians sit at 5% to 8%. A healthcare channel showing 4% CTR is not underperforming — it is performing near the healthcare median, and the CTR gap versus platform-wide is expected and largely structural.
Thumbnail treatment variation produces meaningful within-healthcare CTR differences. This chart shows the observed median CTR band by thumbnail treatment type:
Thumbnail treatment            Median CTR band
Doctor face (well-lit, direct) ██████░░░░  4.5-6.5%
Patient face (with consent)    ██████████ 5.0-7.5%
Procedure clip still frame     ██████░░░░  3.5-5.5%
Text-only + branding           █████░░░░░  2.5-4.0%
Graphic + text combination     ██████░░░░  3.0-4.5%
Before/after (compliance-safe) ███████░░░  4.0-6.0%
Patient faces with documented consent lead the CTR distribution when the treatment is used sparingly and the patient story is genuinely relevant to the video topic. The compliance perimeter around patient faces is strict — the NMC Ethics Code 2026 requires explicit written consent, patient content cannot be presented as clinical evidence of efficacy, and DPDP Act 2023 obligations require documented data handling. Channels using patient faces without meeting those obligations trade a short-term CTR uplift for a long-term compliance exposure the study returns to in Section 8.
Doctor faces perform strongly across specialties. The consistent variables are lighting, direct eye contact, and thumbnail-legible framing — the doctor is recognisable from a phone-sized preview, not a wide shot that looks like a stock image. Channels where the doctor's face becomes visually consistent across thumbnails build a "brand recognition" CTR uplift over 20+ videos that no other single thumbnail variable produces.
Text-only and heavy-graphic thumbnails underperform in healthcare in India. The reasons are mixed — mobile-preview legibility, lack of human-face pattern recognition, and audience association of text-heavy thumbnails with lower-effort content — but the pattern is consistent enough that channels defaulting to text-only should treat the pattern as an opportunity to test face-forward alternatives.
What "good" thumbnail CTR looks like in 2026 for healthcare in India: 4% to 5% is the honest median for a well-run channel; 6% to 8% is strong; above 8% is exceptional and usually indicates either a specialty with unusually high viewer intent (skin concerns, hair loss, fertility) or a specific video with viral thumbnail characteristics. A blanket sub-3% average across a whole channel is a signal to invest in thumbnail A/B testing before doing anything else, because CTR compounds — a 1 percentage point uplift on a channel getting 500,000 impressions per month is 5,000 additional views.
Section 3: Retention benchmarks and where healthcare drop-offs actually happen
Absolute average view duration matters more than percentage retention for YouTube's algorithm, because absolute watch time is what compounds session watch time and drives Suggested-surface distribution. Retention percentages behave differently for short versus long videos, so this section reports absolute duration in the length bands healthcare content actually publishes.
Median observed absolute view duration by video length:
Video length             Median AVD band
Shorts (under 60s)       ██████░░░░  25-40 seconds
5-8 min explainer        █████░░░░░  2:45 - 3:30
8-15 min guide           █████░░░░░  4:00 - 5:30
15-25 min deep dive      ████░░░░░░  6:30 - 9:00
25+ min Q&A/compilation  ████░░░░░░  8:00 - 12:00
Healthcare audiences stay significantly longer on longer content than the generic YouTube norm suggests. A 15-minute condition explainer that holds 6 to 9 minutes of average view is performing well; the same 40% to 60% retention range on a 15-minute entertainment video would be exceptional. High retention on healthcare long-form reflects viewer intent — a patient researching a treatment decision is investing time deliberately, not scrolling for entertainment.
Drop-off patterns are consistent enough across the observation base to name. Three drop-off failure modes explain the large majority of underperforming healthcare videos:
The slow intro. Roughly 40% to 55% of healthcare videos ICG audits lose 15% to 25% of viewers in the first 15 seconds because the intro is too slow — clinic logo animation, "Hi, I'm Dr. X and today we're going to talk about..." preamble, and a hook that arrives at 0:30 or later. The remedy is structural: the hook question and a specific answer preview belong in the first 5 seconds, and the clinic identification can move to the 0:30-0:45 second mark once the viewer is committed.
Over-produced visuals with under-produced substance. Roughly 20% to 30% of healthcare videos show a retention cliff at the 2:00 to 3:00 mark — the point where a viewer expecting substantive content realises they're watching a stylised piece that repeats the same three points with different B-roll. The remedy is content density: three to five distinct, non-overlapping points per five minutes of video, each with a specific example or number the viewer takes away.
The missing hook renewal. Long-form healthcare videos (12+ minutes) that don't re-hook at the mid-point show a consistent 15% to 25% drop at the 6:00 to 8:00 mark. The remedy is chapter architecture — an explicit chapter marker at the mid-point paired with a spoken preview of what's coming next resets viewer attention and preserves 10% to 20% of the audience that would otherwise drop.
Shorts retention is a separate discussion. Healthcare Shorts typically show 30% to 50% full-completion rates — high compared to entertainment Shorts, low compared to Instagram Reels. The best-performing healthcare Shorts have a genuine specialist-answering-a-real-question format rather than a repurposed long-form segment cropped to portrait — the substance-to-length ratio has to be higher for a 45-second Short to feel worth watching.
Retention benchmarks are the diagnostic axis where YODA's Diagnostics step spends the most module time, because retention gaps are the most immediately fixable performance problem — a video with a poor thumbnail requires a new thumbnail; a video with a poor first 15 seconds can often be re-edited without a re-shoot, and the fixed version begins earning retention within 48 hours of the writeback.
Section 4: The organic-versus-paid contribution most channels never disclose
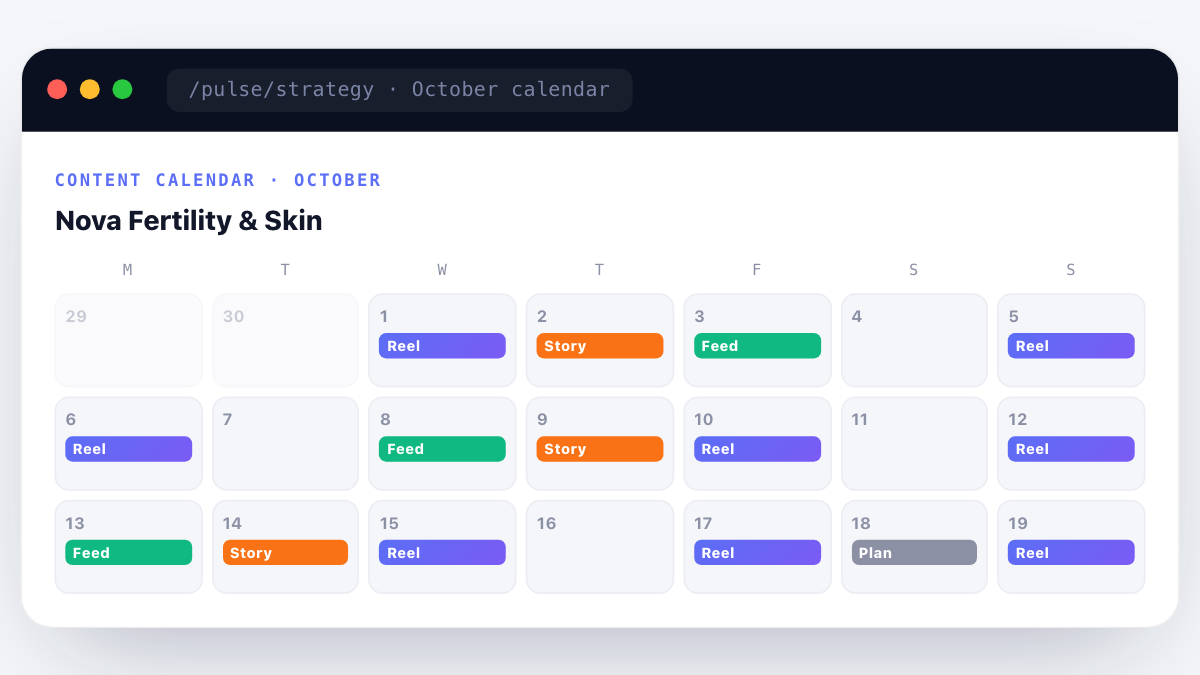 Prism Pulse content calendar showing the month ahead with Reel, Feed and Story slots colour-coded per day for a healthcare Instagram account" width="1200" height="675" loading="lazy" decoding="async" style="width:100%;height:auto;display:block;">
This is the section healthcare marketing teams and agency partners most often want to avoid, because it is the section that most often produces uncomfortable conclusions. Paid promotion — YouTube Ads spend to boost views on specific videos, or channel-level promotion campaigns — contributes 30% to 55% of total views on healthcare channels that use it. Channels with paid views stripped out are often one-quarter to one-half of their reported size.
Across the ICG-managed subset where ad-account access is available (roughly 65 of the 150 observation channels), the distribution of paid contribution to total views looks like this:
Paid share of views         % of channels
0% (pure organic)           ███░░░░░░░  ~30%
1-25% (light paid)          ████░░░░░░  ~25%
26-50% (moderate paid)      █████░░░░░  ~25%
51-75% (heavy paid)         ███░░░░░░░  ~15%
76%+ (paid-dominated)       █░░░░░░░░░  ~5%
Most healthcare marketing teams do not do this separation. Public dashboards, agency reports, and internal reviews frequently present blended view counts as evidence of "growth" without separating what the algorithm surfaced from what a media budget bought. This produces predictable decision errors: a channel that "grew 40% this quarter" on 60% paid share actually grew 16% organically, which is materially different information for a marketing director deciding whether to increase spend or reallocate to a different channel.
YODA's core methodological commitment is to subtract paid views before making any judgement. Every diagnostic, every strategy recommendation, every optimisation call is made on organic data by default, with the paid overlay shown separately and clearly labelled. The reason is not ideological — paid promotion is a legitimate tool — the reason is that decisions made on blended data mistake bought attention for earned attention, and the two need different subsequent actions.
A common pattern the operational aggregate surfaces: a channel presents to a new agency with 500,000 total views over 90 days. Ad-account audit reveals 320,000 of those views were paid. The organic 180,000 across 15 videos averages roughly 12,000 organic views per video — a respectable but not extraordinary organic performance. The client's existing understanding of the channel was materially wrong, and the entire strategy conversation restarts from the correct base.
The reverse pattern is also common. A channel presents as "flat" with 80,000 total views over 90 days. Ad-account audit reveals zero paid spend. The organic 80,000 across 12 videos averages roughly 6,700 organic views per video — genuinely modest, but earned, and the strategy conversation focuses on the leverage a modest paid budget would produce on already-organic-Winner videos.
The uncomfortable observation across the ICG-managed subset: roughly 15% of healthcare channels using paid promotion are running promotion on videos that would not have grown organically to any meaningful degree. These are what YODA calls "paid-only visibility" videos — the paid spend buys a view count that returns to near-zero organic velocity the day the campaign stops. This is not a failure of paid; it is a failure of what to spend paid on. Section 9 returns to what top-decile channels do differently here.
Section 5: Google AI Overview citation rates for healthcare YouTube in 2026
Google AI Overview — the AI-generated answer that increasingly sits above traditional organic results for informational healthcare queries — cites YouTube video content as one of its source types when the source signals structured factual density and E-E-A-T alignment. Citation rates for healthcare YouTube content in India have moved from near-zero at the start of 2025 to a meaningful, measurable slice of primary specialty queries in 2026.
Across the observation base and the sample of specialty queries ICG tracks for managed clients, healthcare YouTube channels are cited by Google AI Overview for roughly 8% to 15% of their primary target queries in 2026. Specialty variation is significant. Directional bands:
Specialty            AIO citation rate band
Dermatology          ██████░░░░  12-18% of primary queries
Dental               █████░░░░░   9-14%
IVF/Fertility        ████░░░░░░   7-12%
Ophthalmology        █████░░░░░   8-13%
Orthopaedics         ████░░░░░░   6-11%
Cardiology           ███░░░░░░░   5-10%
General clinic       ███░░░░░░░   4-8%
The dermatology-and-dental lead reflects the same query-volume and viewer-intent structure that drives subscriber growth for those specialties — Google's AI Overview is more likely to pull YouTube citations on queries where YouTube already ranks organically, and dermatology/dental content ranks better than average on the informational queries AI Overview targets.
The predictors of AI Overview citation are more tractable than most healthcare marketing teams assume. In the observation base, subscriber count is a weak predictor. The stronger predictors, in rough order:
Structured chapters. Videos with explicit chapter markers — properly formatted description timestamps at 0:00, 1:30, 4:00, and so on with clear titles — are cited by AI Overview at roughly 2x to 3x the rate of otherwise-comparable videos without chapters. Chapters give the AI a structured entry point into what the video covers and where.
Factual density in the first 60 seconds. Videos that state a specific, factual claim in the first minute — a treatment duration, a recovery timeline, a specific medication class, a specific compliance framework — are cited at higher rates than videos that spend the first minute on brand introduction. The AI is looking for extractable facts, and the first minute is the sample window.
E-E-A-T signals in the description and end-screen. Named clinician byline, credentials, clinic-website link, and a professional-body or council reference (an NMC registration or a specialty-body membership) all increase citation probability. AI Overview is calibrating for source authority, and these are the signals that resolve.
Sourced claims when a clinical claim is made. A video that mentions a study, a guideline, or a professional-body position and links to the source in the description is cited more often than a video making comparable claims without sourcing. This is not just about SEO — it is about the AI having a way to verify the claim it is about to cite.
Citation recency matters. AI Overview refreshes source selection continuously, and citations are not sticky — a video cited for a query in June 2026 may not be cited for the same query in August 2026 if a newer, better-structured video enters the corpus. Channels treating AI Overview citation as a durable achievement rather than an ongoing effort see citation rates decay over 6 to 12 months.
The MOHFW (mohfw.gov.in) and NMC (nmc.org.in) publications are frequently co-cited alongside YouTube content on healthcare-authority queries, and healthcare channels that reference or align with those authority sources are structurally more likely to be selected as the video citation in the same AI Overview panel.
Section 6: Comment sentiment distribution and ORM risk patterns
Comment sections on healthcare YouTube channels are simultaneously the most valuable audience-research asset a clinic owns and the most under-managed reputation-risk surface a clinic ignores. This section covers both — the sentiment distribution ICG observes across the base, and the reputation-risk patterns that repeat.
Aggregate comment sentiment across Indian healthcare channels in the observation base:
Sentiment    Share of comments
Positive     ████████████░░  60-75%
Neutral      ████░░░░░░░░░░  15-25%
Negative     ██░░░░░░░░░░░░   5-12%
Spam         █░░░░░░░░░░░░░   3-8%
The positive slice is dominated by treatment-praise comments, doctor-thanks comments, and general validation — high volume, low individual signal, high aggregate signal that the channel is trusted. The neutral slice is dominated by clarification questions ("Is this treatment available for X age group?"), scheduling questions ("How do I book a consult?"), and off-topic-but-friendly comments.
The negative slice is where reputation risk concentrates. Across the base, the negative comment categories break down roughly as follows: treatment-outcome complaints (rare in absolute terms but severe when they appear), pricing complaints (frequent, low individual severity, cumulative reputational drag if unanswered), scheduling/access complaints (frequent for larger clinics, indicative of ops rather than clinical issues), and comparative-claim challenges ("Dr. X at [other clinic] said the opposite" — usually resolvable through clarification but destructive if ignored).
The spam slice varies more than the other categories — 3% on well-moderated channels, 8% or higher on channels where auto-moderation is off and manual moderation is inconsistent. Spam damages watch-session quality signals (Google demotes channels with high spam-to-legitimate ratios in comment threads) and can occasionally cross into DPDP or ASCI territory when spam comments include phone numbers, unsubstantiated pharmaceutical recommendations, or personal information.
The reputation-risk pattern that repeats: a single unaddressed negative comment sitting under a video for more than 72 hours is disproportionately dangerous. It surfaces in search snippets, it becomes the top-liked comment when the algorithm surfaces controversy engagement, and it produces a Google search result for the clinic's name paired with the negative-sentiment phrase within 2 to 4 weeks. The remedy is not deletion — deletion visibly reads as suppression and often worsens the signal — the remedy is a professional, clinical, timely response that acknowledges the concern without over-committing to clinical claims.
The most common patient fears surfaced in comments across the base: cost transparency (does the video specify treatment cost, and if not, will the clinic tell me), duration honesty (is the recovery timeline the video shows realistic), risk disclosure (has the video mentioned what can go wrong), qualification proof (is the doctor in the video actually credentialed), and consent handling (was the patient in the testimonial actually informed). Every one of these fears has a direct compliance framing — NMC ethics, ASCI substantiation, and DPDP consent all touch these questions — and channels that address them proactively in video content see the volume of fear-driven comments drop by roughly 30% to 50% over 6 months.
Section 7: Where Indian healthcare YouTube viewers actually are — geography, device, age
Geographic distribution of healthcare YouTube viewership in India is uneven in ways that shape content strategy, targeting, and city-page infrastructure decisions. The observation base shows a fairly consistent shape across specialties, with modest variation for city-embedded clinics (a Bangalore-only dermatology channel over-indexes on Bangalore metro traffic) versus nationally-distributed content (a fertility-education channel with pan-India relevance).
Aggregate viewer geography across the base:
Location bucket                        Watch-time share
Tier 1 metros (Delhi NCR, Mumbai,      ██████████████  50-60%
  Bangalore, Chennai, Hyderabad,
  Kolkata)
Tier 2 cities (30+ cities)             ███████░░░░░░░  20-28%
Tier 3+ towns and rural                ████░░░░░░░░░░   8-15%
NRI diaspora (UAE, US, UK, Canada,     ████░░░░░░░░░░   8-16%
  Singapore, Australia primary)
The Tier 1 dominance is unsurprising — Tier 1 metros have higher YouTube penetration on premium devices, higher English-language content consumption, higher search-driven discovery of healthcare content, and higher discretionary spend to convert viewership into consult bookings. Delhi NCR and Mumbai together typically account for 20% to 30% of total watch time for a nationally-positioned Indian healthcare channel.
The Tier 2 slice is where channel growth compounds fastest through 2026. City-tier watch-time distribution shifts approximately 2 to 3 percentage points annually toward Tier 2 as smartphone penetration deepens and Hindi/regional-language healthcare content matures. Channels producing content in Hindi (or bilingual English-Hindi) capture Tier 2 growth measurably faster than English-only channels serving the same specialty.
The NRI diaspora slice is under-served by generic Indian healthcare content and over-served by generic Western healthcare content. Channels producing India-specific healthcare content with awareness of NRI-relevant angles (treatments during India visits, second opinions on care received abroad, comparative healthcare economics) capture disproportionate NRI watch time. The consult-conversion rate on NRI traffic is meaningfully higher for specialties where treatment cost or specialist availability differs materially between India and the diaspora country (IVF is the archetype; ortho and dental are strong secondaries).
Device mix is roughly 75% to 85% mobile, 10% to 18% desktop, 3% to 8% connected-TV. Mobile share continues creeping up, and CTV share is the fastest-growing category — up from roughly 1% to 2% in 2023 to 3% to 8% in 2026, and expected to reach 6% to 12% by 2027 as smart-TV YouTube app usage grows in urban households. Content that assumes mobile-first legibility (thumbnail text large enough for phone screens, chapter titles readable on small screens, essential information conveyed audibly rather than only visually) performs across the whole device distribution.
Age brackets skew younger than casual observation suggests. Peak viewership for most Indian healthcare channels sits in the 25 to 44 band — Millennials and older Gen Z are the primary healthcare-research audience on YouTube. The 45 to 64 band is meaningful (roughly 20% to 30% of watch time) but grows more slowly. The 18 to 24 band shows up strongly on specific specialties (dermatology, dental cosmetic, hair loss) and lightly on others (cardiology, ortho).
Gender split varies dramatically by specialty. Dermatology and IVF/gynae skew female (65% to 80% female viewership). Cardiology and ortho skew slightly male. Dental and general medicine split closer to 50/50. These splits should shape thumbnail casting, script tone, and CTA language — a dermatology thumbnail featuring a female patient face outperforms an identical thumbnail featuring a male doctor by measurable CTR on female-skewing audiences.
Section 8: Compliance failure patterns across Indian healthcare channels
Compliance is the section most likely to be skimmed and most likely to be worth reading twice. Roughly one in three healthcare channels ICG audits during onboarding carries at least one clear compliance exposure — meaning content already published that violates NMC Ethics Code 2026, ASCI Guidelines 2022, DPDP Act 2023, PC-PNDT Act 1994, or ART Act 2021 provisions in a way that would not survive scrutiny if a complaint were filed.
The distribution of failure incidence across the observation base:
Framework                       Incidence in audits
ASCI (unsubstantiated claims)   ██████░░░░  20-30% of channels
NMC (patient identification)    █████░░░░░  15-25%
DPDP (consent/data handling)    ████░░░░░░  12-20%
ART Act (fertility success)     ███░░░░░░░  8-15% (fertility only)
PC-PNDT (fertility language)    ██░░░░░░░░  5-10% (fertility only)
Ad Substantiation (paid promo)  ████░░░░░░  10-18%
ASCI substantiation failures are the most common category. The archetypal example: a video description or spoken segment claims a treatment is "the most effective option" or "the best treatment available" without a citation, a comparative study, or a substantiation trail. ASCI Guidelines 2022 (ascionline.in) prohibit unsubstantiated comparative claims in advertising, and YouTube video content marketing a treatment is advertising for these purposes. The remedy is either substitution ("a well-established option for patients with X") or substantiation (a specific comparative citation).
NMC patient-identification failures occur when a video features a patient in a way that identifies them (face, name, distinctive medical detail) without documented explicit consent. The NMC Ethics Code 2026 requires informed consent for patient identification in marketing content, and consent must be documented in a way the clinic can produce if challenged. Verbal-only or assumed consent does not clear this bar.
DPDP consent failures overlap with the NMC category but are distinct. Under the Digital Personal Data Protection Act 2023, patient personal data (including patient stories, patient images, and patient-identifying medical details) is personal data under the Act, and the clinic acting as data fiduciary has obligations around consent, purpose limitation, and data-subject rights. Channels featuring patients without a documented DPDP-compliant consent chain carry regulatory exposure separate from the NMC exposure.
ART Act failures are specific to fertility content and center on success-rate claims. The ART Act 2021 requires accurate reporting of success rates and prohibits misleading claims. Videos claiming success rates without the underlying data, without cycle-specific breakdown, or with cherry-picked patient cohorts violate this provision. Fertility channels most frequently trip on this by using aggregate lifetime clinic success rates without the per-cycle, per-age-group, per-cause breakdown the regulation implies.
PC-PNDT Act adjacencies are less common but severe when they occur. The Pre-Conception and Pre-Natal Diagnostic Techniques Act 1994 prohibits sex-selection content and content facilitating sex determination. Fertility and gynae channels touching topics near this territory need explicit compliance review of scripts before publication.
Ad Substantiation failures on paid-promoted videos are a separate exposure. When a video is boosted with a media budget, it becomes advertising for regulatory purposes even if it was produced as educational content, and the substantiation bar shifts. Channels boosting videos without pre-flight compliance review frequently promote content that would have passed as organic content but fails as advertising.
The insurance-of-compliance ROI is high. A one-time script and description audit against the five frameworks costs a fraction of a single successful complaint's cost — reputational, regulatory, and platform-suspension — and the audit produces a compliance addendum the clinic can point to during any subsequent challenge.
Section 9: What the top 10% of Indian healthcare YouTube channels do differently
Across the observation base, top-decile healthcare channels — the roughly 15 channels sitting above the 90th percentile on the composite of organic subscriber growth, organic view growth, retention, and AI Overview citation rate — share a set of operational patterns that separate them from median channels doing similar-looking things. The differentiators are not glamorous. They are process discipline, editorial calendar rigour, and a small set of tactical practices consistently applied.
Cadence discipline. Top-decile channels publish on a predictable schedule for 12+ consecutive months without breaks. The frequency varies (weekly, twice-monthly, or twice-weekly are the most common), but predictability matters more than frequency. Median channels publish in bursts followed by silences — a pattern that costs 30% to 50% of algorithmic momentum with every silence, because YouTube's Suggested surface prefers channels with recent, consistent activity.
Editorial calendar built from audience signal. Top-decile channels build their next 8 to 12 weeks of content from a specific pipeline: audience comment questions, YouTube search suggestions for the channel's specialty, competitor content gaps, and seasonal specialty patterns. Median channels build their content calendar from the doctor's or marketing team's intuition. The signal-driven pipeline produces videos with a 2x to 3x higher rate of "answered the question someone was searching for" — which is exactly what YouTube's algorithm rewards.
YODA-style workflow adoption. Not necessarily YODA specifically, but the discipline the YODA workflow enforces — organic separated from paid before any judgement, decisions rather than dashboards, writeback of optimisation improvements directly to YouTube — is present in every top-decile channel in the observation base. The specific tool varies; the underlying operational habit does not.
Thumbnail A/B testing as a standing practice. Top-decile channels A/B test thumbnails on 30% to 60% of published videos, review results at 14 days, apply the winning variant, and treat the losing variant as data for the next thumbnail brief. Median channels ship one thumbnail per video and never revisit. The compounding CTR uplift from consistent A/B testing over 12 months is typically 20% to 40% on channel-average CTR.
Playlist architecture. Top-decile channels build genuine playlist architecture — 4 to 8 topical playlists, each with 5 to 15 videos, ordered such that Playlist Play behaviour compounds session watch time. Median channels leave videos unplaylisted or drop everything into a "All Videos" pseudo-playlist that produces no session-watch benefit. The session-time uplift from correct playlist architecture is roughly 15% to 30%.
Cross-channel amplification. Top-decile channels embed their videos in relevant clinic-website blog posts, share them into WhatsApp broadcast lists for existing patients (where compliant), and reference them from GBP posts or Instagram — treating YouTube as one node in a distribution network rather than a standalone channel. The referral-view lift from disciplined cross-channel amplification is typically 20% to 50% of organic views on qualifying videos.
Comment engagement discipline. Top-decile channels reply to substantive comments within 24 to 48 hours and reply to at least 30% of the first-week comments on every video. The response quality matters — professional, clinical, non-committal on treatment specifics, warm on human details. This produces two compounding effects: the comment-response signal that YouTube's algorithm reads as author engagement (a modest ranking factor), and the audience trust signal that shows up in subscriber conversion 4 to 8 weeks later.
Compliance discipline as competitive advantage. Top-decile channels run every script through a compliance filter before shoot, every description through the filter before publish, and every promoted video through a heavier ad-substantiation check before boost. This looks like overhead until it isn't — the top-decile channels have zero compliance-driven takedowns in the observation base; median channels have an average of one per year.
Paid spend on organic Winners only. Top-decile channels use paid promotion to reinforce videos that are already showing organic Winner signals — above-median CTR, above-median retention, above-median velocity. Median channels use paid promotion to prop up underperforming videos, which converts paid budget into short-term view counts that collapse when the spend stops.
None of these differentiators is a secret. All of them are operationally hard, and that operational difficulty is exactly why the differentiators separate the top decile from the median. The gap between top-decile and median is process discipline, not talent or budget.
Section 10: Ten predictions for Indian healthcare YouTube in 2027
These predictions are directional rather than forecast — where ICG's YODA operations team expects the market to move over the 12 to 18 months ahead based on the trends visible in the 2026 observation base.
- AI Overview citation rate for healthcare YouTube will roughly double, into the 15% to 25% band for primary specialty queries. The AI Overview corpus is expanding rapidly and healthcare-content-with-chapters is what it prefers.
- AI Overview will eat 10% to 20% of YouTube's search-share on informational healthcare queries. Patients getting the answer from Google without clicking through will reduce YouTube search-driven views on the same queries, while lifting YouTube Suggested and Browse discovery for the videos AI Overview cites.
- YODA-native workflows will become table stakes. Managed healthcare YouTube services without organic-vs-paid separation, writeback discipline, and 3-rank-race tracking will lose to services that have those capabilities.
- Compliance enforcement will tighten measurably. Expect more ASCI complaint filings on healthcare video content, more NMC ethics-code enforcement actions, and clearer DPDP guidance on patient-featuring content. The insurance-of-compliance ROI will move from "high" to "essential".
- Hindi and bilingual healthcare content will out-grow English-only healthcare content. Tier 2 audience growth will pull the aggregate Indian healthcare YouTube audience toward multilingual content and away from English-only.
- Shorts will consolidate rather than expand as a share of healthcare watch time. Healthcare information demand is intrinsically long-form; Shorts will remain useful for top-of-funnel awareness but will not displace long-form as the primary consult-driving format.
- Connected-TV YouTube viewership will roughly double for healthcare content. From 3% to 8% today into the 6% to 12% band by end of 2027, with implications for thumbnail legibility, audio quality, and end-screen CTA design.
- Patient testimonial content will become more regulated and less common. The intersection of NMC 2026, DPDP 2023, and ASCI 2022 makes compliant patient testimonials operationally expensive, and channels will substitute clinician-explainer content for patient-story content.
- The organic-vs-paid literacy gap will narrow. More marketing directors will ask for organic-separated reporting; more agencies will provide it; the current 30-55% blended-reporting fog will lift toward transparency as an evaluation standard.
- Comment-section ORM will become a named budget line. Reputation-management staffing on comment threads will move from ad-hoc to standing budget for healthcare channels above roughly 5,000 subscribers, driven by the compounding search-snippet risk of unaddressed negative comments.
The platform ICG uses to run this at scale: YODA
ICG runs healthcare YouTube marketing for clinics, hospitals, and specialty groups using YODA — our AI-native healthcare YouTube marketing platform. YODA sits on top of a channel's data and does four things no dashboard does: it separates organic from paid views at every step (so a promoted video can never masquerade as organic growth), it gives decisions not dashboards (every video gets a state + next action), it writes back to YouTube directly (improved titles, tags, descriptions, chapters applied straight to the platform), and it tracks the three rank races — YouTube search, Google web, and Google AI Overview citations.
YODA runs the full 6-step workflow — Overview, Diagnostics, Strategy, Optimisation, Reputation (ORM), and Competitor Intel — with 40+ analysis modules organised under those steps. ICG's managed YouTube service uses YODA end-to-end. See the Healthcare YouTube Marketing pillar guide for the full scope, or the Healthcare YouTube Marketing Agency service page for engagement details.
Book a YODA demo on WhatsApp → or request a free healthcare YouTube channel audit →
Methodology limitations and disclaimers
The data source underlying this study is ICG's operational aggregate — patterns observed across roughly 150 healthcare YouTube channels ICG actively manages, audits during onboarding, or monitors as part of competitor intelligence work for managed clients through 2025 and 2026. It is not paid research. It is not peer-reviewed. It is not a statistically representative sample of the Indian healthcare YouTube market as a whole — it is a sample of the channels ICG has line of sight into, which over-represents clinics that engaged with a healthcare-specialist agency and under-represents channels operated entirely in-house without external partnership.
Every number is presented as a range because the underlying data does not warrant point estimates. Specialty-specific claims from smaller samples (ophthalmology, gastroenterology, psychiatry) are flagged where used. The organic-vs-paid separation depends on ad-account access and is drawn from the ICG-managed subset (approximately 65 channels), not the full 150. The AI Overview citation rate is drawn from ICG's tracked query set for managed clients and is directional rather than exhaustive.
Compliance-related observations describe patterns ICG has observed and remediated during onboarding audits; they are not legal advice. Any specific channel's compliance position depends on its specific content, consent chain, and paid-promotion practices and should be reviewed by qualified counsel or a compliance-trained agency partner. Nothing in this study should be treated as an official interpretation of the NMC Ethics Code 2026, ASCI Guidelines 2022, DPDP Act 2023, PC-PNDT Act 1994, or ART Act 2021.
Related reading
- Healthcare YouTube marketing pillar guide 2026
- Organic vs paid YouTube views for healthcare channels
- Healthcare YouTube benchmarks: what good looks like in 2026
- How to get cited in Google AI Overviews for healthcare YouTube
- Healthcare YouTube marketing agency service page
FAQ: what a journalist would ask about this data
How representative is the ~150-channel observation base of the wider Indian healthcare YouTube market? It is representative of the segment of the market that engages professionally with healthcare-specialist marketing agencies — which over-indexes on urban clinics, specialty groups, and hospitals with a marketing function, and under-indexes on channels run entirely in-house by single-doctor practices without external partnership. The findings should be read as calibration ranges for professionally-managed or professionally-audited healthcare channels, not as a census of the entire Indian healthcare YouTube market.
Why are the numbers presented as ranges instead of specific percentages? Operational aggregate observations do not support point-estimate precision. A range gives a competent healthcare marketing team a calibration band they can position their own channel against. A single number would imply the underlying data has a level of precision it does not have. This is a deliberate rigour choice — false precision is more misleading than an honest range.
Can you name the specific channels in the observation base? No, for two reasons. First, ICG's managed clients have contractual confidentiality — their channel-level performance data is not ours to publish. Second, disclosing the monitored competitor channels would compromise the competitor-intelligence work those observations feed. The aggregate patterns are shareable; the channel-level identification is not.
How were AI Overview citation rates measured given Google does not publish this data? ICG tracks a defined query set for managed clients — the queries each channel is targeting for organic YouTube search visibility. For each tracked query, ICG monitors whether an AI Overview panel appears, and if so whether the panel cites a YouTube video (from the client channel or a competitor). The citation rate is the share of tracked queries where the client channel is cited within the AI Overview panel. This is a channel-level measurement, not a market-wide census; the ranges reported reflect the observed distribution across the managed subset.
Is a channel outside the reported percentile bands automatically failing or succeeding? No. The bands are calibration references, not verdicts. A channel below the 25th percentile on subscriber growth may be a new channel where sample sizes are too small for meaningful comparison, a specialty channel where the growth ceiling is structurally lower, or a channel with genuine execution issues — the diagnostic work distinguishes these. Similarly, a channel above the 90th percentile may be sustainably strong or may be riding a specialty-specific demand spike that will normalise. The bands are the start of the conversation, not the end of it.
What is the single most common measurement error healthcare marketing teams make about their own channels? Reporting blended paid-plus-organic view counts as evidence of channel growth without separating the two. Paid contribution of 30% to 55% is common enough that presenting total views as "growth" routinely overstates real organic performance by a factor of 1.4x to 2.2x. Correcting this measurement error is the single-highest-ROI change most healthcare marketing teams can make to their reporting.
Which compliance framework produces the most operational risk for Indian healthcare channels in 2026? ASCI Guidelines 2022 produce the highest volume of exposure because the substantiation bar catches so many everyday marketing claims. NMC Ethics Code 2026 produces the highest per-incident severity when triggered — patient-identification failures and unsubstantiated clinical claims can drive regulatory action against the doctor personally, not just the clinic. DPDP Act 2023 produces the fastest-growing compliance surface because patient-data handling in video content is only now becoming widely-audited.
Do these findings apply to healthcare YouTube channels outside India — for example UAE, US, or UK diaspora content? Partially. The retention, CTR-to-retention structural relationship, and organic-vs-paid measurement discipline generalise to healthcare content in other markets. The specific bands (subscriber growth rates, AI Overview citation rates, geographic distribution, compliance frameworks) are India-specific and should not be extrapolated to other markets without independent measurement. Compliance frameworks especially are country-specific and non-transferable.
How often will ICG refresh this study? Annually at minimum, with directional interim updates when a market-moving change occurs — a significant Google AI Overview algorithm shift, a new NMC or ASCI ruling with content-marketing implications, or a substantial reshaping of YouTube's recommendation surfaces. The 2027 refresh is planned for Q1 2027 and will include a retrospective check on how well the ten predictions in Section 10 held up.
Where can a journalist or researcher cite these findings? This blog post is the canonical source. The URL, publication date, and ICG attribution are appropriate for citation. For interview requests, data-set clarifications, or additional context on specific findings, the ICG operations team is reachable via the WhatsApp link in the YODA section above or through the standard press contact on the ICG website.
About the data
This study is authored by ICG's YODA operations team, drawing on aggregate observations across the healthcare YouTube channels ICG manages, audits, and monitors. YODA is ICG's AI-native healthcare YouTube marketing platform — Healthcare YouTube Marketing Agency service page · Free healthcare YouTube channel audit.
Book a free 30-minute Brand & Growth Diagnostic.
It's a working session, not a sales pitch — you leave with a written root-cause analysis you can act on, whether or not you engage ICG.
The three platforms
behind every ICG engagement.
Beacon
CAPI middleware that fixes Event Match Quality, translates CRM statuses to Meta-standard events, dedups across channels.
Agency OS
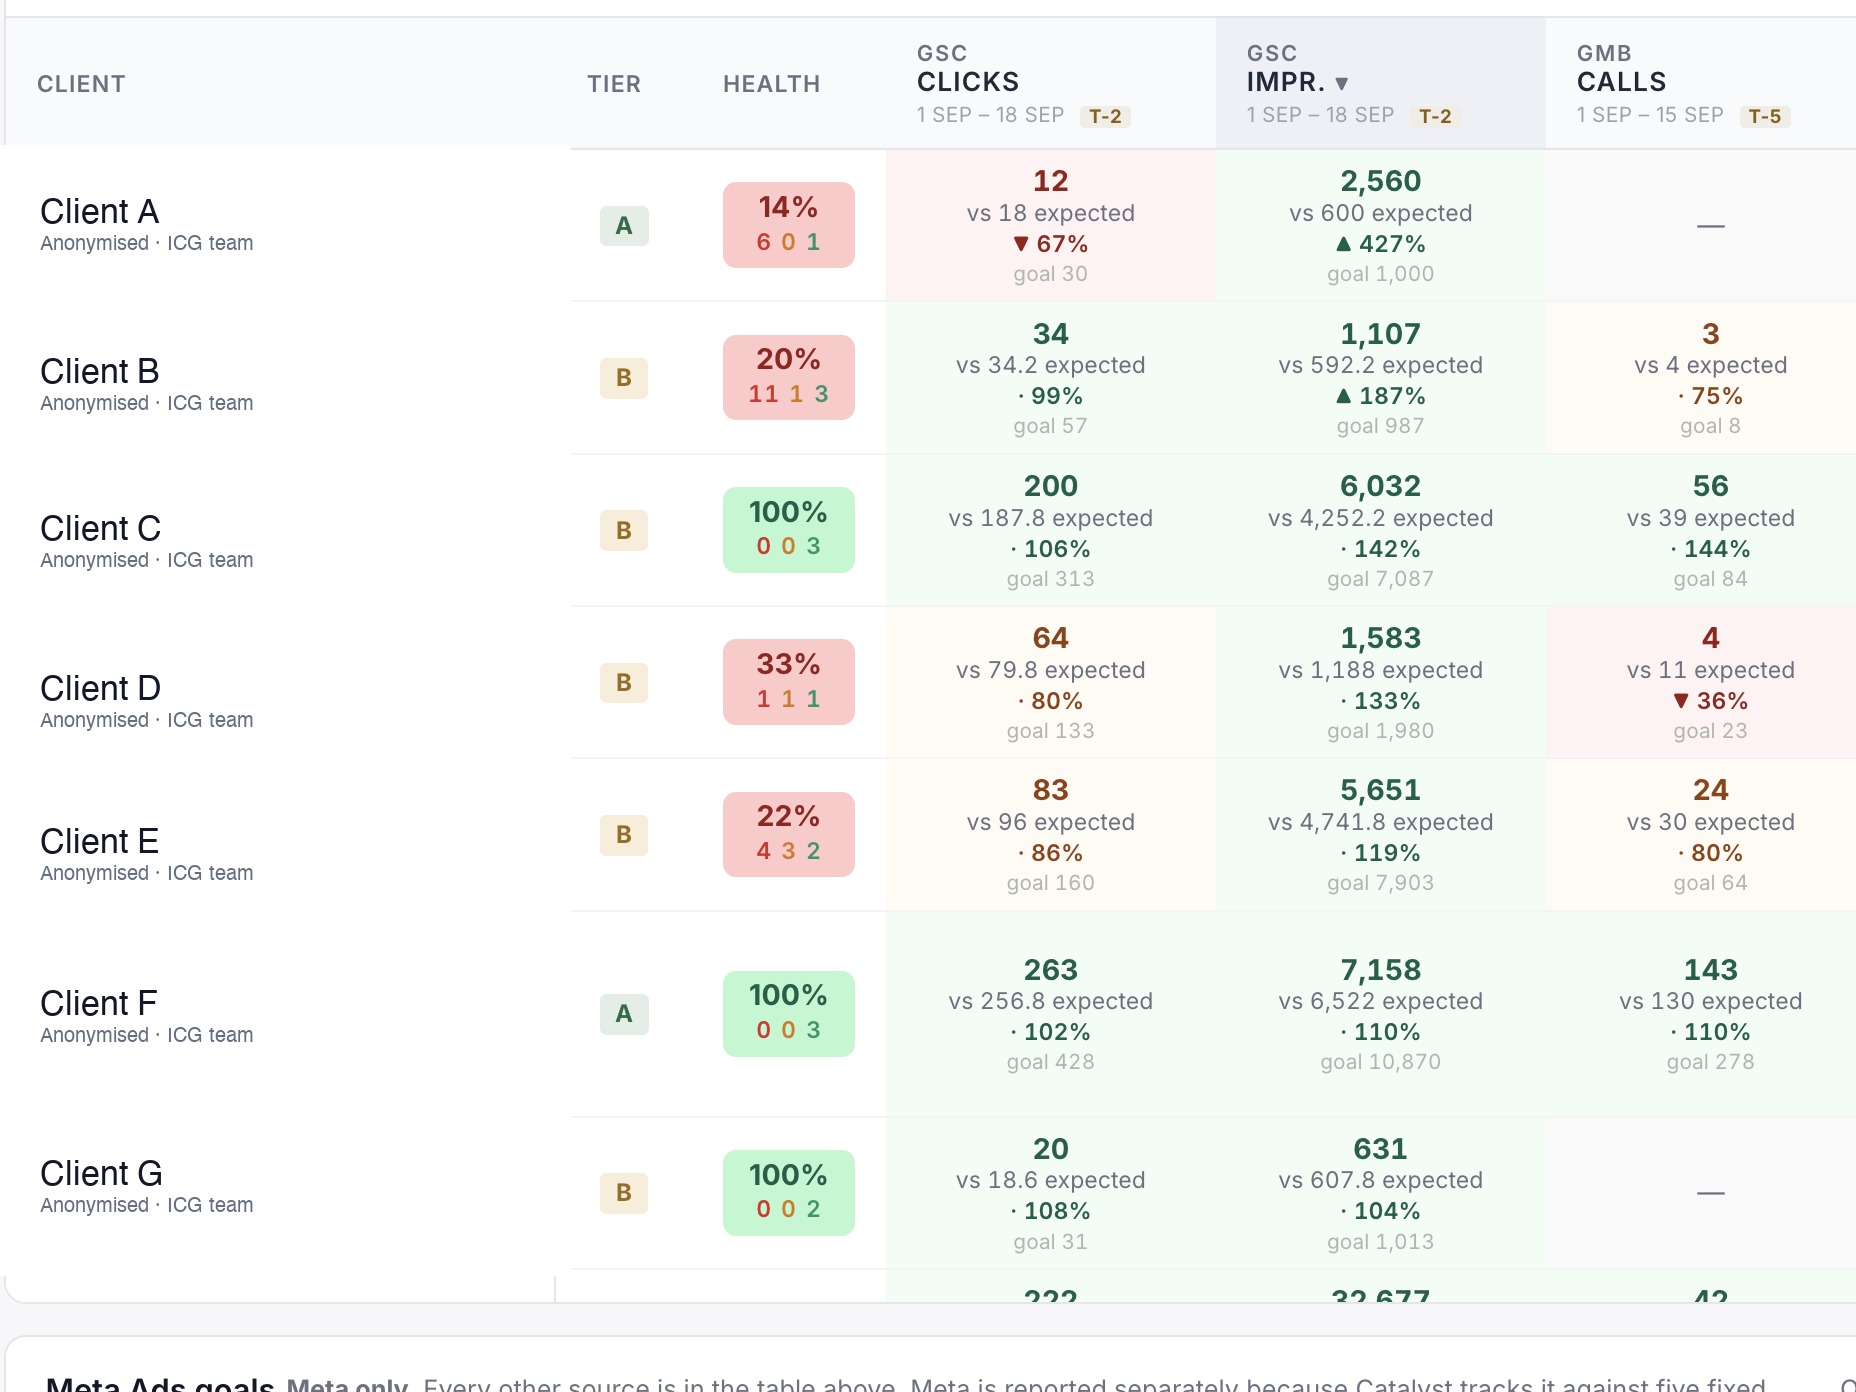
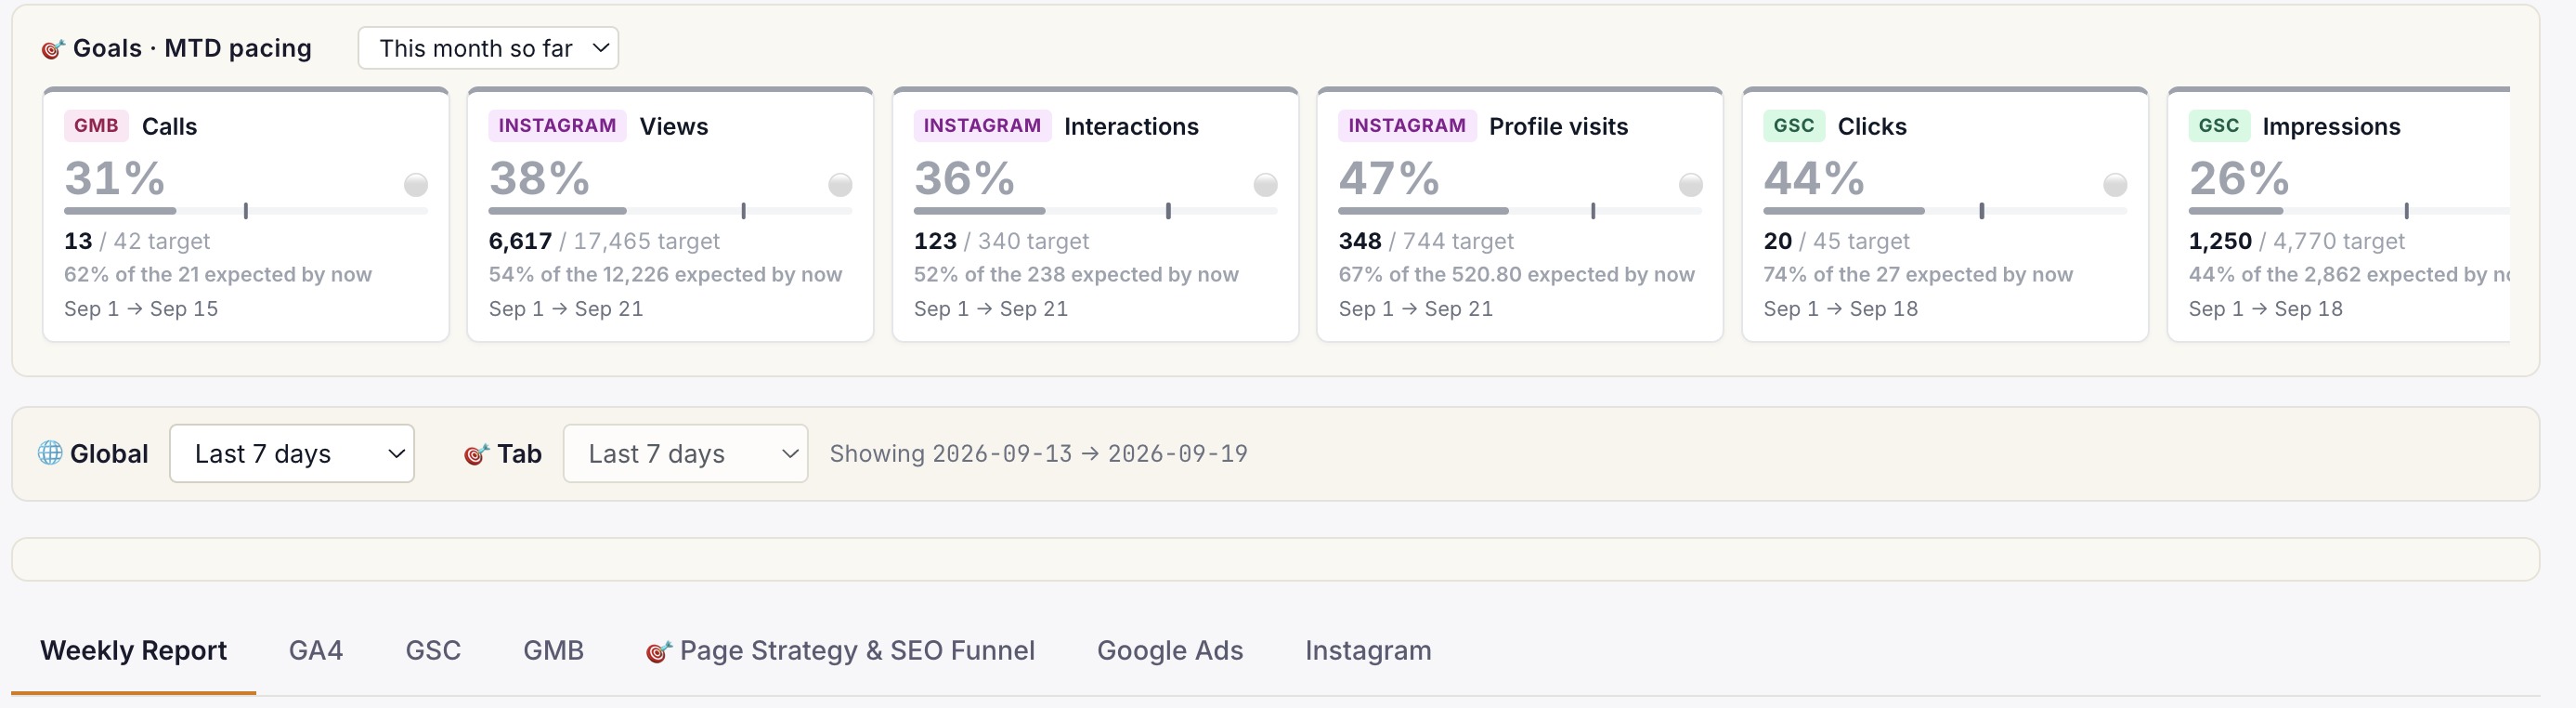
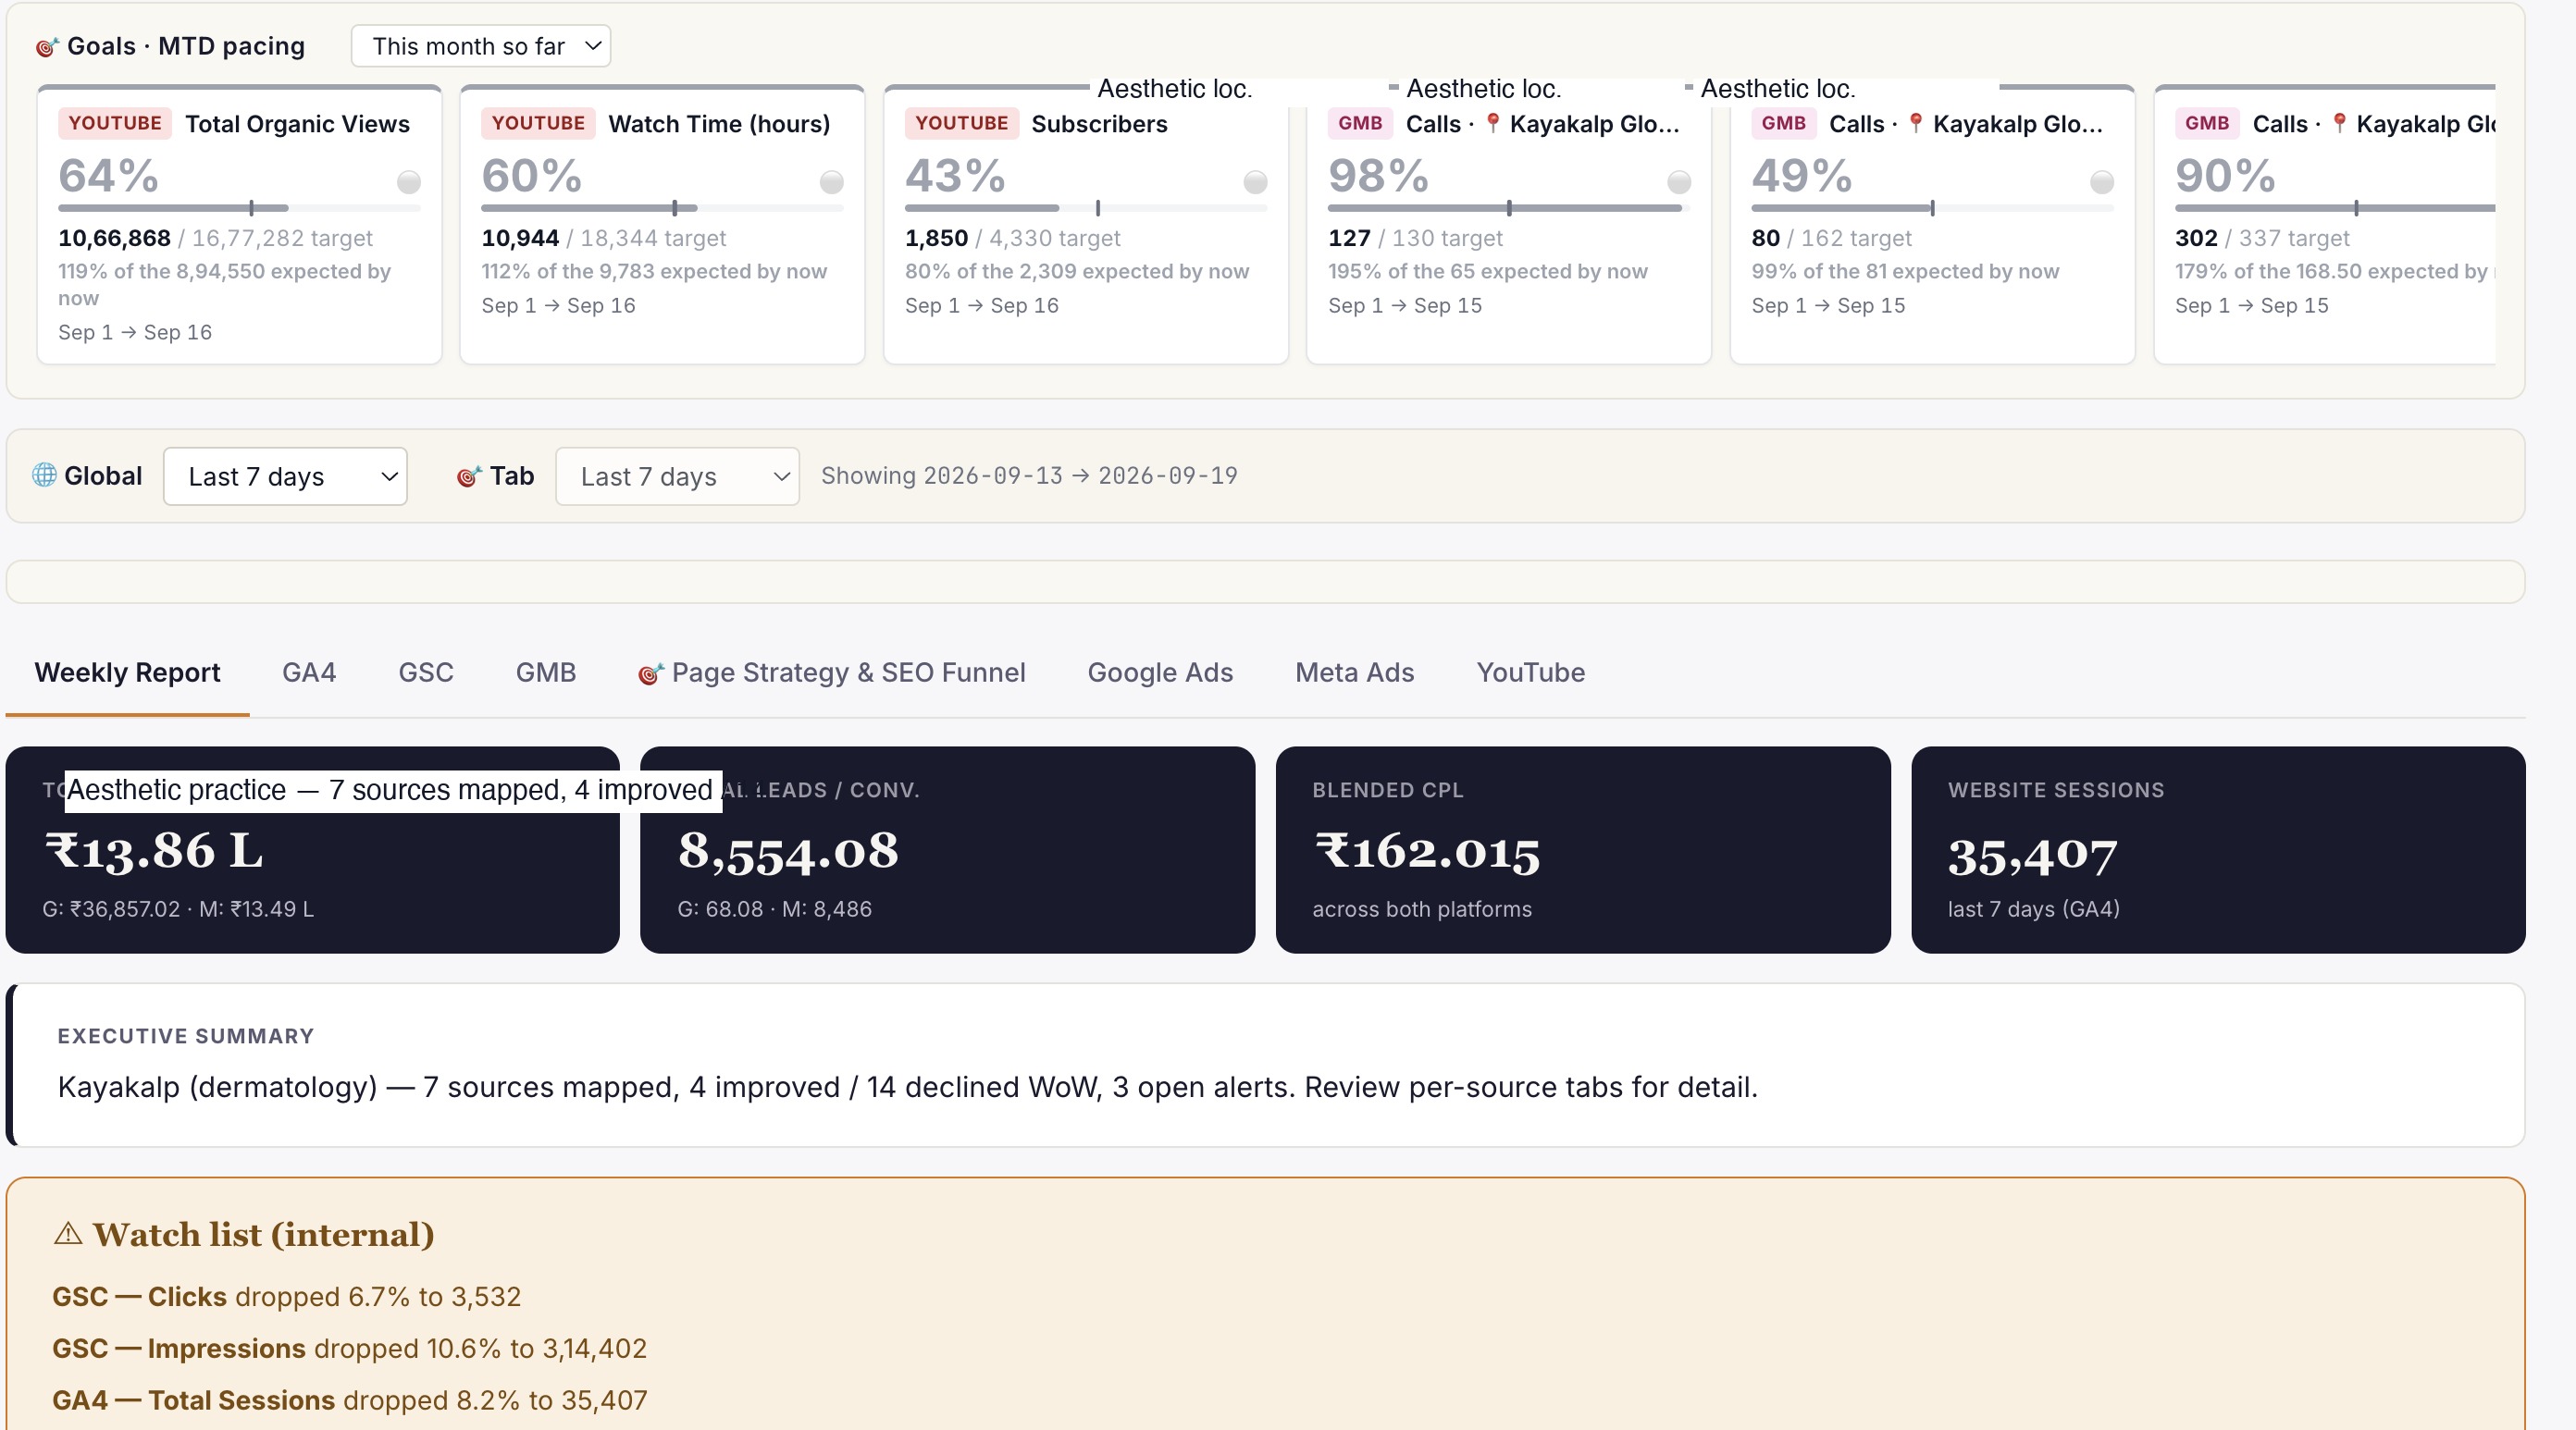
Live client dashboard. GSC, GA4, Google Ads, Meta Ads, IVR calls in one view. Login anytime, not monthly.
Phoenix
Clinic revenue intelligence over your PMS. Daily action queue: Prevent Loss, Maintain & Engage, Grow Revenue. Multi-centre rollout.
Or book a free 30-min audit to see all three in action on your account.
Healthcare brands
that already run on ICG.
A representative slice of the 150+ healthcare brands ICG has delivered for across India. Most engagements remain under NDA.


What ICG clients say · on video.
"Scale up of organic channels and business consulting. ICG has absolute domain authority in their field."
"Working with ICG transformed how we acquire IVF patients in Gurgaon. They understand the fertility journey from inquiry to consult..."
"What Ichelon accomplished — they got all my ideas and worked over 3-4 months to create an amazing, super-customised website."
The intelligence stack behind this playbook.
Every ICG engagement runs on the Search Intelligence Trifecta — Angryturtle for GMB, SIE for search and AI Overview, YODA for YouTube. Live product screens below.
Need help operationalising this?
Every ICG service is healthcare-only, NMC + DPDP-aware, and built around the patient-research patterns that drive Indian healthcare growth in 2026.
Every practice welcome — packages from ₹20,000/mo.
Goals-Driven engagements · Performance-Linked Payout Models available
More from
ICG.
Five trends shaping Indian healthcare marketing through 2027: AI-first patient research, Conversions API adoption, ABDM discovery, the AEO w...
Healthcare AIO is the discipline of getting your clinic or hospital cited inside Google AI Overviews, ChatGPT and Perplexity answers — not j...
Conversational-search advertising places brand messages inside AI chat answers — ChatGPT, Perplexity, Copilot — rather than beside a results...
Stop guessing.
Book a Diagnostic.
30 minutes. Free. With the AI-powered healthcare-only marketing agency 150+ brands already run on. No slides, no pitch, no hard close.


