


Angryturtle Geo-Grid methodology for hospitals: grid density, catchment radius, mobile emulation, pin drift and competitor overlay for multi-location chains
Angryturtle Geo-Grid methodology for hospitals — the operator-facing playbook for multi-location chains. Grid density choices (5x5 vs 7x7 vs 11x11), catchment radius per specialty, mobile-emulated searches, per-location pin drift diagnosis, competitor overlay analysis, sample chain playbook and the cadence a marketing director should actually run.
No pitch. Written root-cause diagnosis. AI-powered, healthcare only.
Direct answer
Angryturtle Geo-Grid methodology for hospitals — the operator-facing playbook for multi-location chains. Grid density choices (5x5 vs 7x7 vs 11x11), catchment radius per specialty, mobile-emulated searches, per-location pin drift diagnosis, competitor overlay analysis, sample cha...
TL;DR
Angryturtle Geo-Grid methodology for hospitals is the piece hospital marketing directors and multi-location clinic chains use to move Geo-Grid beyond a screenshot tool into a real geographic operating system. Anyone shortlisting healthcare local SEO for hospitals in India eventually runs into the same problem — Google local pack rankings differ street by street, and a single "average rank" number hides more than it reveals. This piece documents how Angryturtle Geo-Grid actually works for hospitals with multiple locations, and how a marketing director should choose grid density, catchment radius, cadence, and diagnostic overlays.
Why Geo-Grid matters more for hospitals than for solo clinics
A solo dental clinic in a single neighbourhood has a small catchment, a single competitive set, and a fairly uniform local pack experience across its addressable market. A 4-location hospital chain in a Tier-1 city has four distinct catchments, four different competitive sets, four different specialty mixes, and often four different Google Business Profiles behaving very differently.
A single "we rank 3 for cardiology hospital" number lies about all four. Location A might rank 1 in its own two-kilometre catchment and 12 in the neighbourhood 6 kilometres north. Location B might rank 8 everywhere. Location C might rank 3 in the eastern half of its catchment and 15 in the western half because a competitor is closer.
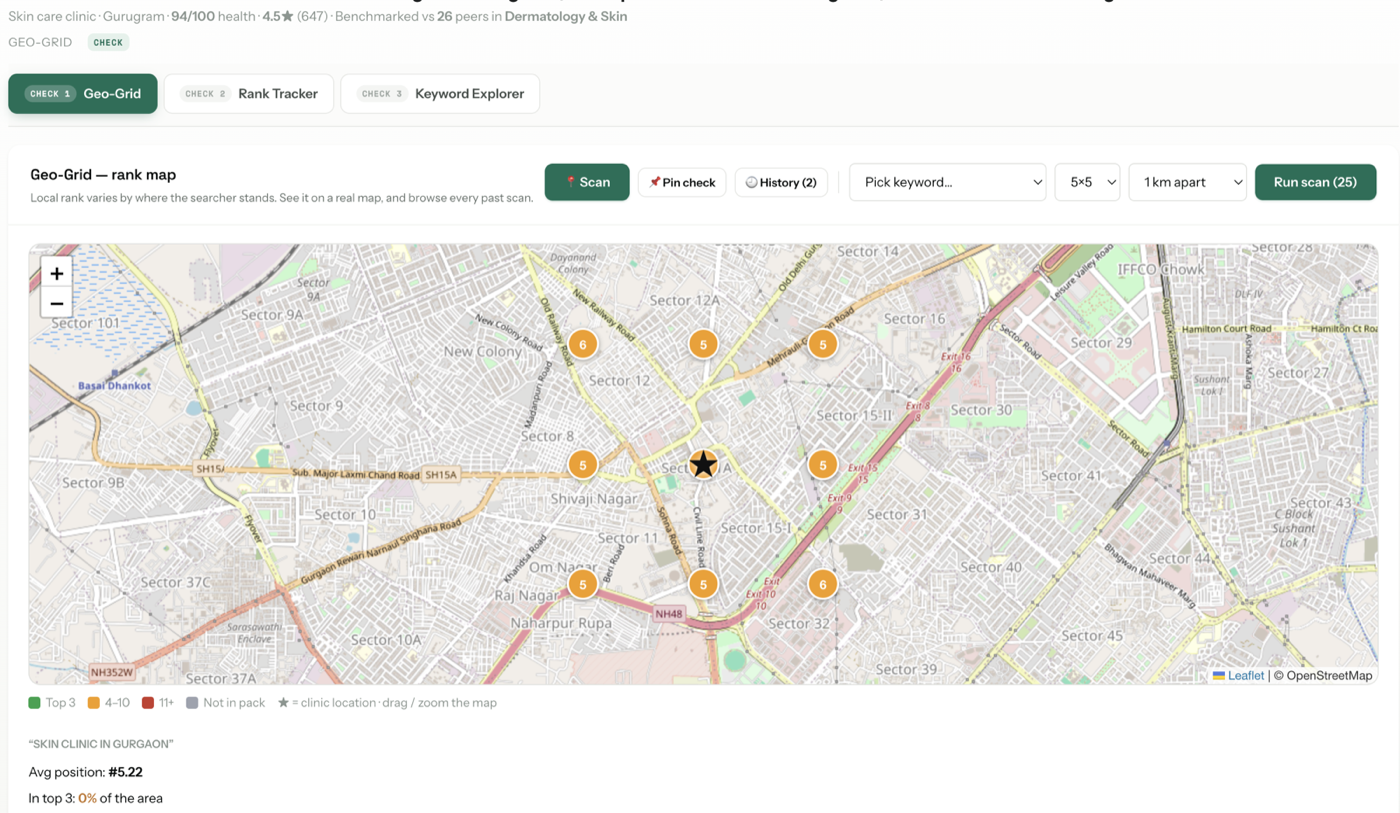
Geo-Grid replaces the single number with a spatial map — the profile's rank plotted across a grid of geographic points around each location. The map shows the truth. Where does the profile actually win? Where does it get beaten? Which competitor beats it in which sub-area? That map is the foundation for hospital chain local SEO because there is no other way to see the reality of a multi-catchment operation.
Grid density choices: 5x5 vs 7x7 vs 11x11
Angryturtle Geo-Grid supports multiple grid densities. Choosing correctly matters — density that is too coarse hides sub-area patterns, density that is too fine wastes scan credits without producing more decision-useful information.
5x5 grid — 25 points. Default for solo locations with a small catchment (2-3 km radius). Adequate for a single-clinic dental, dermatology, or physiotherapy practice where the profile sits at the centre and the catchment is roughly symmetric.
7x7 grid — 49 points. Standard for most hospital single-location scans in Tier-1 cities. Captures the profile's own catchment plus meaningful edge-of-catchment competitive dynamics. Recommended baseline for cardiology, orthopedic, oncology and multi-specialty hospitals where catchment radius is 5-7 km.
11x11 grid — 121 points. Reserved for hospitals with unusually wide catchments (superspecialty tertiary care), for hospital chains overlaying multiple locations onto a single map, and for competitive intelligence deep dives where sub-area patterns matter for site-selection or expansion planning.
The rule of thumb: choose the smallest grid that captures the profile's meaningful catchment plus one grid-cell of buffer. Larger grids are seductive because they produce more colourful heatmaps, but the extra data rarely changes the operator's next move.
Catchment radius per specialty
Catchment radius is the physical distance across which the grid is drawn. It should match how far patients realistically travel for that specialty in Indian cities:
- Dental, dermatology, physiotherapy, paediatrics, ENT — 2-3 km. Patients pick nearby.
- Gynaecology, general ortho, ophthalmology, diagnostics — 4-5 km. Patients travel further for continuity of care.
- Cardiology, oncology, IVF, neurology, urology, nephrology — 6-10 km. Patients travel across the city for specialist care.
- Multi-specialty hospitals — 5-7 km baseline, adjusted by the most-searched specialty at that location.
- Superspecialty tertiary hospitals — 10-15 km. Patients cross entire cities.
Catchment radius is also city-specific. Delhi NCR patient travel patterns differ from Bengaluru or Chennai patterns because of traffic realities and transit access. Angryturtle's default catchment radii are healthcare-tuned and Indian-city-tuned, but every profile can override the defaults based on real patient origin data if the hospital has it.
Mobile-emulated searches

Over 90 percent of Indian healthcare local pack queries happen on mobile devices, and Google returns different local pack results for mobile versus desktop. Angryturtle Geo-Grid scans emulate a mobile user agent by default, not a desktop browser, so the data reflects the reality of how patients actually search.
Sub-details that matter:
- Mobile viewport size. Emulation uses a standard Android viewport that Google treats consistently. Non-standard viewports occasionally trigger different ranking behaviour.
- Location signal. Each grid point sends a specific latitude/longitude location signal to Google, mimicking a mobile user physically standing at that grid point. This is how the grid produces geographically-differentiated results.
- Personalisation stripping. Emulated searches use a clean session so personalisation history does not distort the ranking data.
- SafeSearch neutrality. Emulation uses the default SafeSearch setting that most Indian mobile users have, which matters for a small subset of specialty queries.
Desktop-only scans miss the mobile local pack reality. Angryturtle also supports a desktop scan overlay for hospitals that want to compare mobile versus desktop rank differences, but the default and the primary decision surface is mobile.
Per-location pin drift diagnosis
Pin drift is the phenomenon where a profile's ranking drops sharply outside a small radius of its physical location. Every profile shows some pin drift — that is Google's Distance factor doing its job. The diagnostic question is whether the drift pattern is normal or unhealthy.
Angryturtle Geo-Grid classifies pin drift into three patterns:
Normal drift. Profile ranks in top-3 within its centre grid cell, drops to top-5 in the adjacent ring, drops to 6-10 in the outer ring, drops below 10 at the corners. Symmetric decay in every direction. Fine.
Asymmetric drift. Profile ranks well in some directions but drops sharply in others despite similar distances. Usually caused by a nearby competitor with stronger signals in the drop-off direction. Diagnostic move: overlay the competitor's Geo-Grid to see whose profile is beating the client in that direction and why.
Cliff drift. Profile ranks well in a small centre area and drops off a cliff immediately outside it. Usually caused by weak Relevance signals — the profile only wins queries where distance is very small because its category, services or description are not helping it win farther-out queries. Diagnostic move: audit Relevance sub-signals with Rank OS.
Recognising the drift pattern determines the fix. Asymmetric drift is competitor-driven and needs competitive response. Cliff drift is signal-driven and needs Relevance rework. Normal drift means the profile is doing what a profile can reasonably do, and further gains need Freshness, Review Health or Entity Authority moves.
Competitor overlay analysis
Angryturtle Geo-Grid supports overlaying the client profile's heatmap with the heatmaps of specific competitors. The overlay reveals patterns invisible in a single-profile view:
- Territory maps. Where does each competitor dominate? The overlay produces a Voronoi-style territory map showing which competitor owns which sub-area of the catchment.
- Contested zones. Sub-areas where the client and a competitor swap rank position from grid point to grid point. Contested zones are usually the highest-leverage area for competitive investment — moving competitive rank by a single position across a contested zone shifts real query volume.
- Uncontested wins. Sub-areas where the client leads decisively. Defend, do not over-invest.
- Uncontested losses. Sub-areas where a competitor leads decisively. Usually not worth fighting for; these are physically closer to the competitor and Distance will dominate.
The overlay converts abstract "we need to beat Competitor X" conversations into specific geographic conversations — "we need to win contested Zone 3 which sits between our location and Competitor X's location and holds 40 percent of the catchment's query volume."
Sample chain playbook — 4-location IVF chain
A hypothetical 4-location IVF chain in Bengaluru illustrates the methodology in action:
Setup. Each of the four locations gets a 7x7 grid at 8 km catchment radius (fertility patients travel). Mobile-emulated scans run weekly. Top-5 competitors identified per location using the Competitors module.
Diagnosis. Location A shows normal drift and sie" style="color:inherit;text-decoration:underline;text-decoration-color:rgba(42,126,200,.5);text-underline-offset:2px">Rank OS 78. Location B shows cliff drift and Rank OS 54 — Relevance dimension flagged, category set to generic "Fertility clinic" instead of "Fertility physician". Location C shows asymmetric drift toward the east where a chain competitor sits. Location D shows normal drift but low overall rank across the grid — Review Health at 42 with only 60 reviews in a market where competitors have 300+.
Prescription. Location A gets defence work — sustain cadence, protect the score. Location B gets category correction plus services list rebuild inside 30 days. Location C gets a targeted content and review push aimed at the eastern contested zone. Location D gets a 90-day review-collection sprint targeting 15 new reviews per month with a compliant WhatsApp-flow patient outreach.
Outcome tracking. Weekly Geo-Grid scans track each location's rank distribution. Portfolio dashboard shows the chain's overall Rank OS trajectory. Monthly review shows which locations moved and which did not, and why.
The playbook's value is that each location gets a different treatment based on its actual geographic diagnosis, not a uniform "improve rankings" tactic applied everywhere.
Cadence: daily vs weekly vs monthly scans
Scan cadence should match decision cadence:
- Weekly scans for active management. Standard for every Angryturtle-managed hospital location. Weekly scans reveal week-over-week change and support the Monday morning operating rhythm.
- Daily scans for launch periods (first 60 days after a new location opens or after a major fix), competitive escalation periods, and Enterprise tier hospitals tracking a specific strategic threat.
- Monthly scans for stable Elite-band profiles in defence mode where week-over-week movement is negligible and monthly change is more decision-relevant.
- Ad-hoc scans before and after any major change — category correction, review-collection campaign launch, competitor entering the catchment, new website launch. Ad-hoc scans capture cause-and-effect that scheduled scans might average out.
Cadence choice affects scan credit consumption. Angryturtle's pricing tiers include weekly cadence for the standard managed service; daily and higher-density scans are Enterprise-tier features.
What Geo-Grid does not do
Not a paid-search competitive tool. Geo-Grid tracks organic local pack ranking. Paid-search competitive intelligence for Google Ads and Meta Ads runs through separate tools.
Not a query-volume estimator. Geo-Grid shows where a profile ranks; it does not estimate how many searches happen at each grid point. Query volume data comes from GSC, Google Keyword Planner and third-party keyword tools, layered separately.
Not a substitute for GSC. Google Search Console remains the source of truth for click and impression data on branded and website-linked queries. Geo-Grid focuses on local pack ranking, GSC focuses on organic search performance.
Not a substitute for real patient origin analysis. Geo-Grid shows where the profile ranks; only clinic-side patient origin data shows where patients actually come from. Overlay the two for the strongest catchment strategy.
How to get Angryturtle Geo-Grid for your hospital
Angryturtle Geo-Grid is included in every Angryturtle plan. Self-serve at ₹999/- per month supports single-location 5x5 or 7x7 scanning with weekly cadence. ICG-managed from ₹25,000/- per month includes multi-location coverage, competitor overlays, monthly strategic review, and the full hospital-chain playbook. Both are anchored to the Healthcare Local SEO Agency India pillar page with full scope, methodology and pricing.
Book a demo on WhatsApp or start a free trial at angryturtle.ai.
Related reading
 Meta Catalyst IQ long-term comparison view charting Meta Ads performance across quarters with spend, CPQL and volume overlaid" width="1200" height="675" loading="lazy" decoding="async" style="width:100%;height:auto;display:block;">
- Angryturtle Geo-Grid and Pin Checker explained — top-level product overview
- Rank OS scoring methodology — the score sitting behind every grid point
- Competitors module explained — the source of the overlay competitor set
- Hospital chain local SEO India guide — the multi-location playbook
- Multi-location GBP management for healthcare India — operator playbook
- Healthcare Local SEO Agency India — pillar service page
FAQ
How large should the grid be for a superspecialty tertiary hospital? 11x11 grid at 12-15 km catchment radius is standard. Patients travel across the city for tertiary care; the grid needs to capture that catchment reality.
Can two locations of the same chain be scanned on overlapping grids? Yes. Overlapping grids for adjacent locations reveal cannibalisation zones where the chain's two profiles compete against each other for the same queries. Portfolio dashboards flag cannibalisation and support strategic response.
Why mobile emulation and not desktop? Over 90 percent of Indian healthcare local pack queries happen on mobile. Desktop scans miss the reality patients experience. Angryturtle supports a desktop overlay for hospitals that want the comparison, but mobile is the primary decision surface.
How is asymmetric pin drift diagnosed? Overlay the client's Geo-Grid with the competitor's Geo-Grid in the direction of asymmetry. If a specific competitor dominates in the drop-off direction, that competitor is causing the asymmetry. The response is competitive rather than profile-technical.
Can Geo-Grid track a specific procedure query separately from a specialty query? Yes. Per-query grids are supported. A cardiology hospital can run separate grids for "cardiology hospital", "angioplasty", "cardiologist" and specific procedure queries. Cross-query comparison surfaces which queries the profile wins geographically and which it loses.
What happens if a competitor overlay includes a competitor with no GBP? Competitors without GBP are irrelevant to local pack ranking and are dropped from the overlay. Geo-Grid competitive intelligence is scoped to local pack competitors specifically.
How does contested-zone identification actually work? A contested zone is a set of adjacent grid points where the client and a specific competitor swap rank position from point to point. Angryturtle highlights contested zones automatically and surfaces the estimated query-volume weighting of each zone.
Is Geo-Grid useful for solo clinics or only for hospitals? Both. Solo clinics use 5x5 grids at 2-3 km catchment radius and see meaningful information about their own catchment. The hospital-specific methodology in this piece covers multi-location and superspecialty use cases; solo clinic use is simpler.
Can Geo-Grid data be exported for use in internal dashboards? Yes at Agency and Enterprise tiers. CSV export and API access support integration with internal hospital marketing dashboards.
How often should the top-5 competitor list be refreshed? Automatic weekly refresh. New competitors entering the top-5 or existing competitors dropping out are flagged in the monthly report. Manual re-benchmarking is supported for strategic reviews.
Does daily scan cadence risk triggering Google rate limits? No. Angryturtle uses distributed scanning infrastructure that stays well inside acceptable request patterns. Daily cadence is a feature, not a stress on the platform.
Book a free 30-minute Brand & Growth Diagnostic.
It's a working session, not a sales pitch — you leave with a written root-cause analysis you can act on, whether or not you engage ICG.
The three platforms
behind every ICG engagement.
Beacon
CAPI middleware that fixes Event Match Quality, translates CRM statuses to Meta-standard events, dedups across channels.
Agency OS
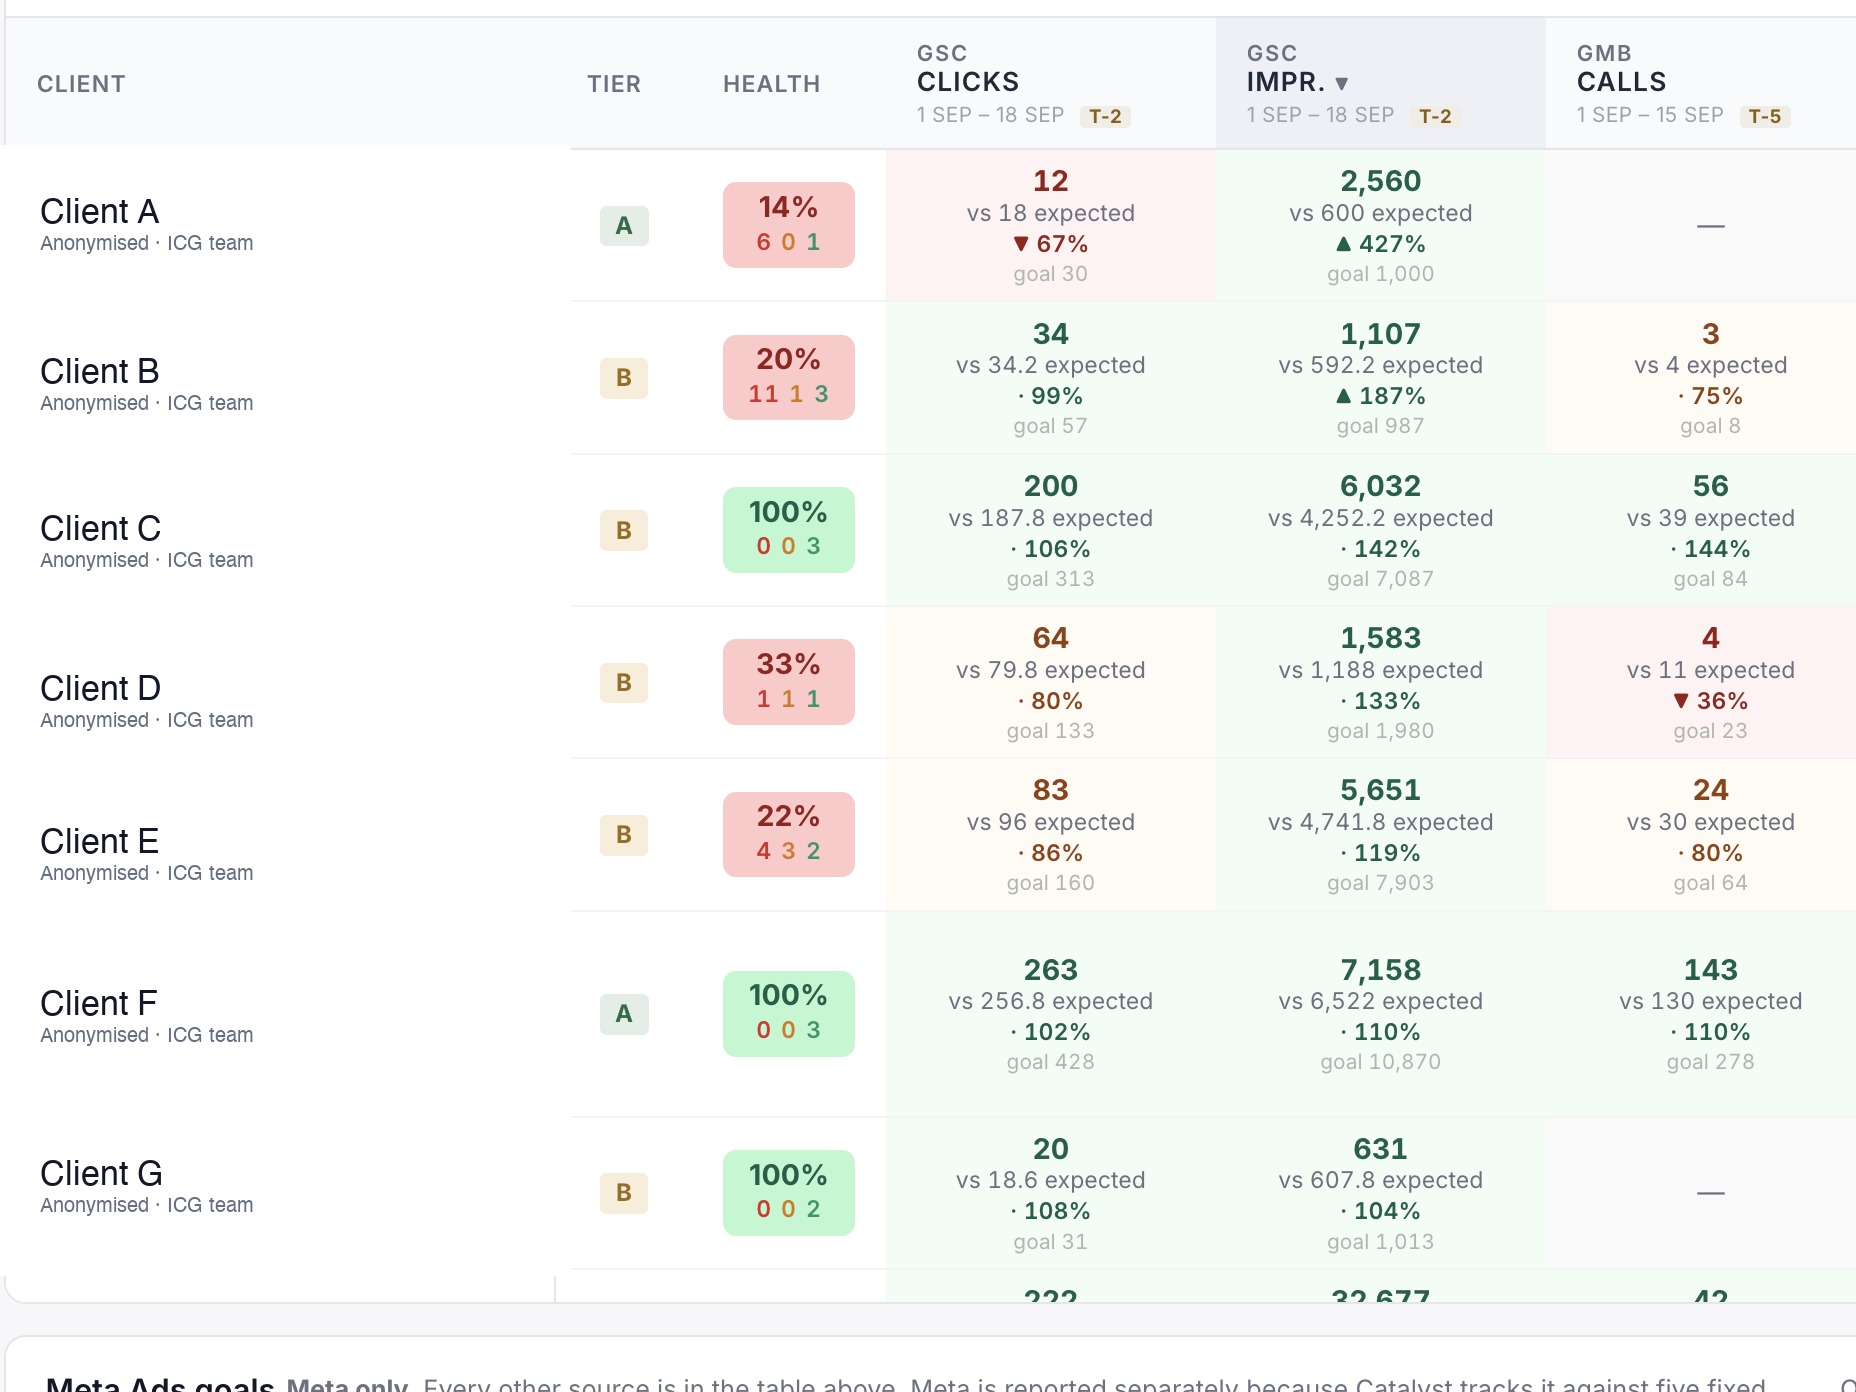
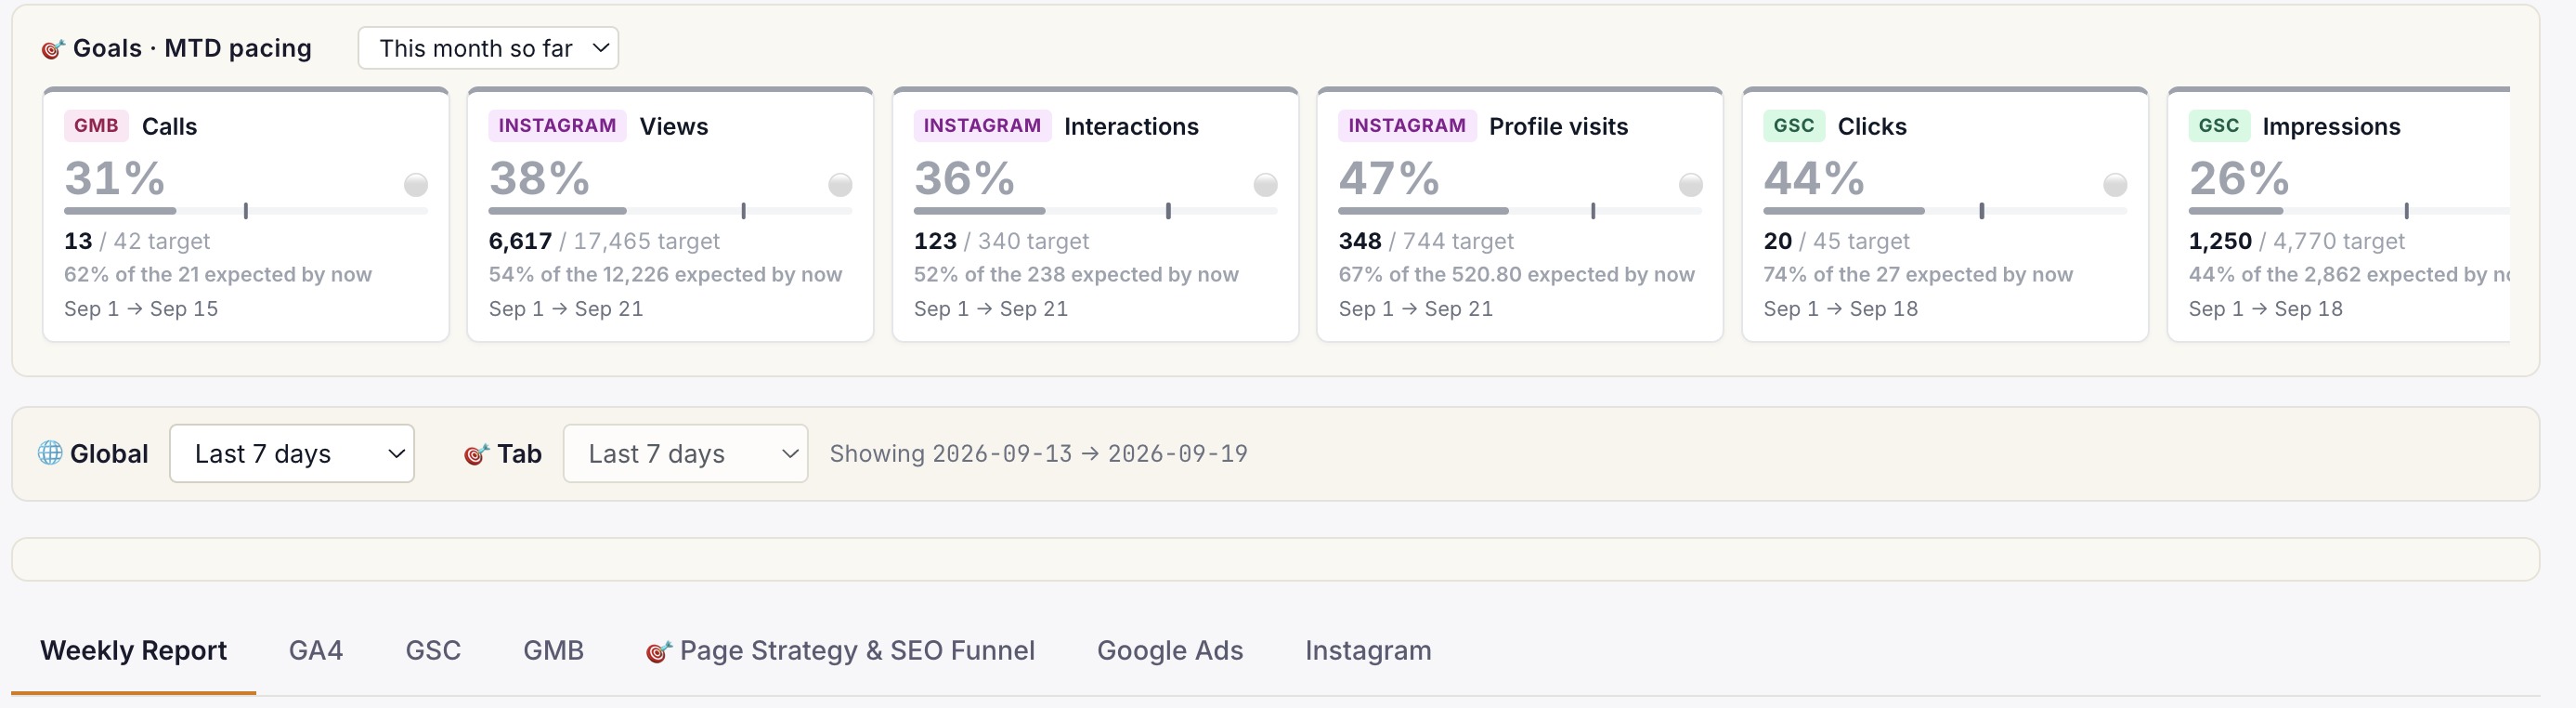
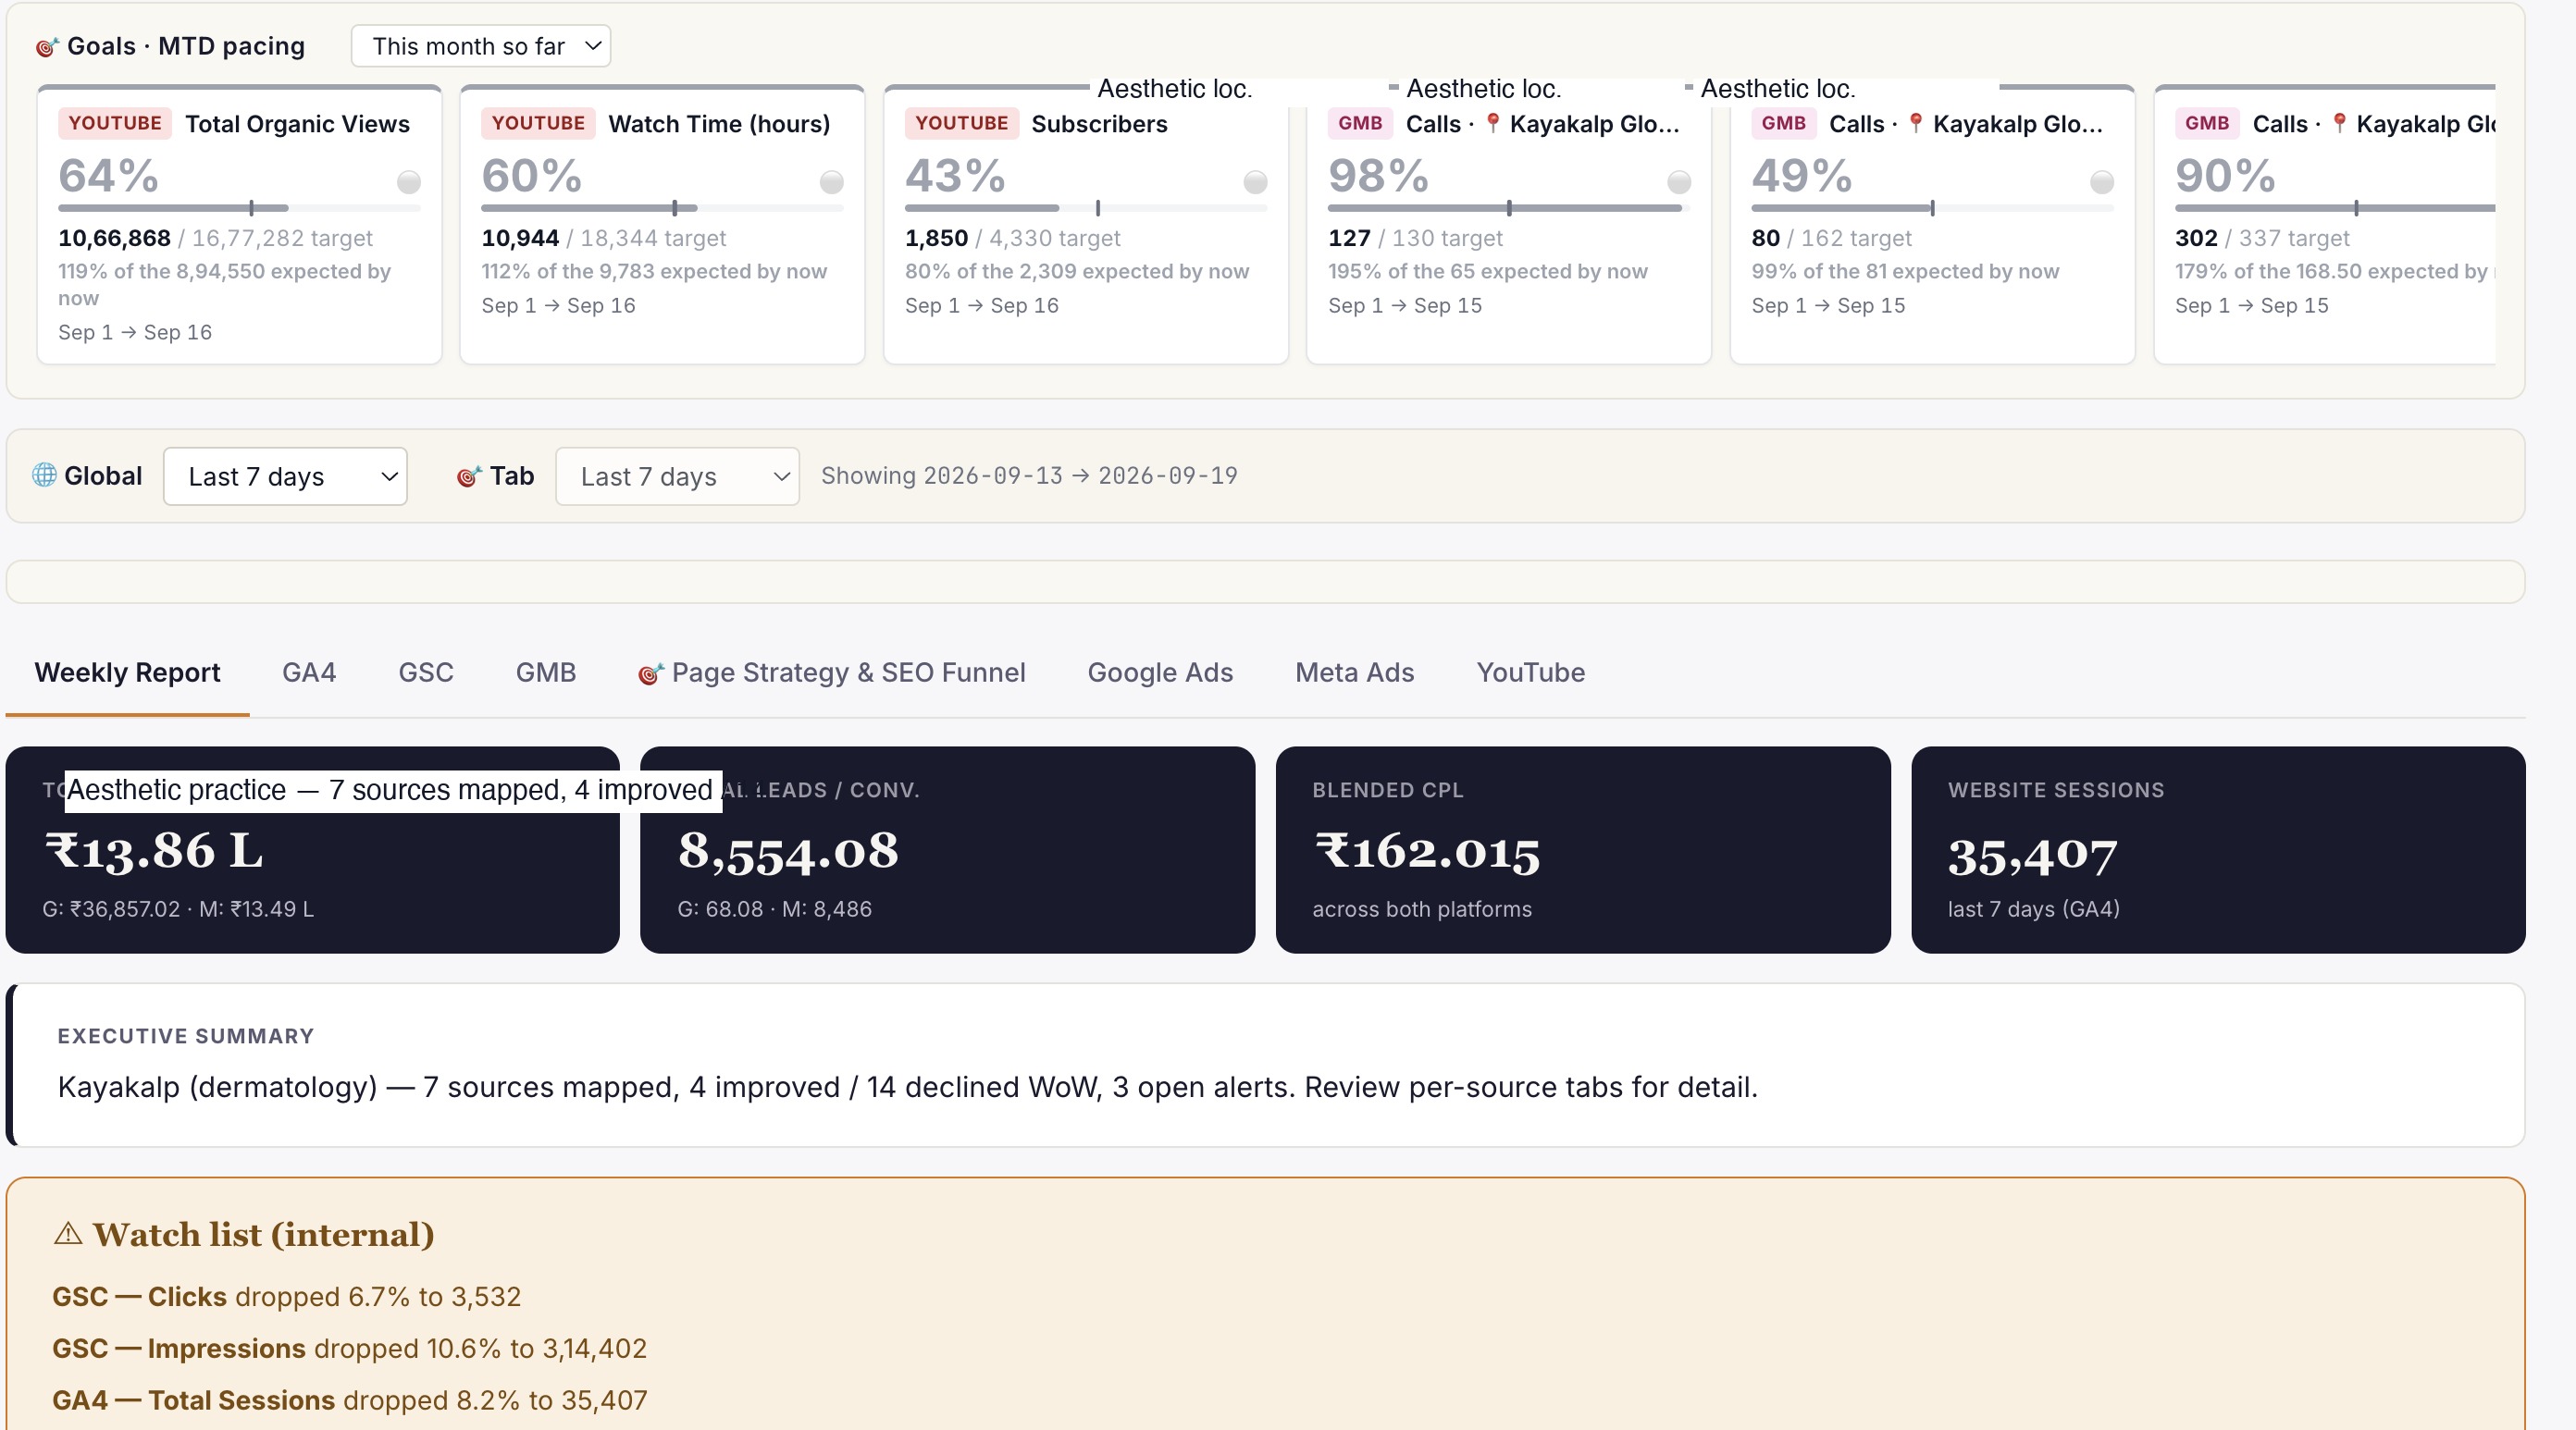
Live client dashboard. GSC, GA4, Google Ads, Meta Ads, IVR calls in one view. Login anytime, not monthly.
Phoenix
Clinic revenue intelligence over your PMS. Daily action queue: Prevent Loss, Maintain & Engage, Grow Revenue. Multi-centre rollout.
Or book a free 30-min audit to see all three in action on your account.
Healthcare brands
that already run on ICG.
A representative slice of the 150+ healthcare brands ICG has delivered for across India. Most engagements remain under NDA.


What ICG clients say · on video.
"Mental health marketing requires a different sensitivity. ICG built compliance-aware campaigns that respect both patients and our..."
"Bariatric surgery patients need a long consideration cycle. ICG built a content + paid system that respects that timeline."
"Working with ICG felt like working with an in-house growth team that happens to specialise in healthcare."
Need help operationalising this?
Every ICG service is healthcare-only, NMC + DPDP-aware, and built around the patient-research patterns that drive Indian healthcare growth in 2026.
Every practice welcome — packages from ₹20,000/mo.
Goals-Driven engagements · Performance-Linked Payout Models available
More from
ICG.
Five trends shaping Indian healthcare marketing through 2027: AI-first patient research, Conversions API adoption, ABDM discovery, the AEO w...
Healthcare AIO is the discipline of getting your clinic or hospital cited inside Google AI Overviews, ChatGPT and Perplexity answers — not j...
Conversational-search advertising places brand messages inside AI chat answers — ChatGPT, Perplexity, Copilot — rather than beside a results...
Stop guessing.
Book a Diagnostic.
30 minutes. Free. With the AI-powered healthcare-only marketing agency 150+ brands already run on. No slides, no pitch, no hard close.


