Med spa KPIs: the weekly dashboard, with formulas and where to get each number
A med spa needs about ten numbers every week: bookings by source, show rate, consult-to-treatment rate, rebooking rate, membership churn, provider utilization, review velocity, review reply rate, rating and cost per booked consultation. Each one comes from a system you already have (booking software, phone tracking, ad accounts and your Google Business Profile), and all of them can be reported as counts and rates without moving patient information into marketing tools.

- Track ten KPIs weekly, grouped into demand, conversion, retention, capacity and reputation.
- Measure marketing by cost per booked and per attended consultation, not clicks or followers.
- Report counts and rates, not patient records. Keep the dashboard free of names and treatment details unless every tool involved is covered by a BAA.
- Benchmarks from our study of 555 US med spas: median 148 Google reviews, average rating 4.87; in our velocity sample (n=115) the median spa added about 6 reviews a month and owners replied to about 61%.
- Review the dashboard every Monday and pick one number to move that week.
- Every practice welcome — retainers from $499/mo, Goals-Driven engagements, Performance-Linked Payout Models available.
- Dallas, Texas LLC
- 10-person US client team · Central Time (CST)
- 25+ US healthcare clients
- BAA signed with every client
- HIPAA compliance training across client and delivery teams
- Contracts and invoices in USD
-
 Primary Care · North Dallas, TXCase study →
-
 MedSpa · North Dallas, TX
-
 Skin Care · Beverly Hills, CA
-
 Dental · Christiansburg, VACase study →
-
 Pediatrics · Blacksburg, VACase study →
-
 Pediatric Dentistry · Blacksburg, VACase study →
-
 Dental · Roanoke, VACase study →
-
 Functional Medicine · Telehealth · USACase study →
“They were able to get all my ideas and work with me over a period of three to four months and create this amazing website. It's super customized, very modern, and it incorporates all the elements that I had wanted — the patient portal, nice pictures, a very interactive website, patient reviews. I would highly recommend their company to anyone who wants to make an excellent website.”
The ten weekly KPIs and their formulas
Short answer: five groups. Demand (are people booking?), conversion (do they show up and buy?), retention (do they come back?), capacity (are providers busy?) and reputation (does Google trust you?).
| KPI | Formula | Source system |
|---|---|---|
| 1. Bookings by source | Count of new bookings, grouped by source (Google Business Profile, search ads, Meta, Instagram organic, referral, walk-in) | Booking system, with source captured at booking |
| 2. Cost per booked consultation | Channel ad spend ÷ consultations booked from that channel | Ad accounts + booking system |
| 3. Show rate | Appointments attended ÷ appointments scheduled (exclude cancellations refilled in time) | Booking system |
| 4. Consult-to-treatment rate | Consultations that led to a treatment within 30 days ÷ consultations attended | Booking system or EMR |
| 5. Rebooking rate | Patients who left with a future appointment booked ÷ patients seen | Booking system |
| 6. Membership churn (monthly) | Cancellations in the month ÷ active members at the start of the month | Billing or membership module |
| 7. Provider utilization | Booked treatment hours ÷ available provider hours | Booking system schedules |
| 8. Review velocity | New Google reviews in the period (weekly count, reported as a monthly rate) | Google Business Profile |
| 9. Review reply rate | Reviews with an owner reply ÷ reviews received in the period | Google Business Profile |
| 10. Average rating | Overall rating, plus the average of reviews received in the last 90 days | Google Business Profile |
Add two monthly measures once the weekly ten are reliable: cost per attended consultation by channel (spend ÷ attended consultations) and revenue per patient over 12 months for each acquisition channel. The second tells you which channels bring patients who come back.
Getting demand and conversion numbers right
Short answer: the hard part is capturing the source of each booking. Fix that first, or every cost metric is guesswork.
Capturing booking source
- Tagged booking links: use a different link (with UTM tags) for your Google Business Profile, each ad campaign, Instagram bio and email. Many booking systems record the referring link.
- Call tracking: a separate tracking number for the Google profile, website and ads. Choose a provider that will sign a BAA if calls are recorded or transcribed and HIPAA applies to you.
- A required source field at booking or check-in ("How did you hear about us?") as a backstop. Keep the options short.
Show rate and consult-to-treatment
- Report new-patient consultations separately from returning visits. A low new-patient show rate usually points to slow confirmation, unclear deposits or a long gap between booking and appointment.
- Our review research found booking and communication was the only theme where complaints outnumbered praise across US med spas (54.2% negative, from a small number of mentions). Reminder timing, confirmation wording and deposit clarity show up in show rate before they show up in reviews.
- Consult-to-treatment rate by provider is a coaching tool, not a league table. Low rates can mean poor-fit leads from a channel, not a weak provider.
To estimate what a booked patient costs you across channels, try our cost per new patient calculator.
Retention and capacity: where profit is made
Short answer: acquiring a med spa patient is expensive; the second and third visits are where it pays back. Rebooking rate, membership churn and provider utilization tell you whether that's happening.
- Rebooking rate is the single most useful retention number for treatments with a natural rhythm, such as neurotoxin, facials and laser series. Track it by provider and by service.
- Membership churn compounds. At 5% a month, members stay about 20 months on average (1 ÷ churn); at 10%, about 10. Pair it with credit usage, which falls before cancellations rise. Our membership guide has a retention routine.
- Provider utilization tells you whether to spend more on marketing or fix the schedule. If utilization is high, more ads mean longer waits; if it's low on certain days, run targeted campaigns or adjust hours. In our study, 74.2% of US med spas were open at least one weekend day, averaging 5.6 days a week.
Reputation KPIs and the benchmarks to compare against
Short answer: track new reviews, replies and recent rating weekly. These are the numbers with published benchmarks, so you can compare yourself directly.
| Benchmark (US med spas, 2026) | Value | Sample |
|---|---|---|
| Average Google rating | 4.87 | 555 med spas, 20 metros |
| Median Google review count | 148 | 555 med spas |
| Spas with fewer than 50 reviews | 15.9% | 555 med spas |
| Spas with 500+ reviews | 13% | 555 med spas |
| Median new reviews per month | 5.83 | Velocity sample, n=115 |
| Average owner reply rate | 61% | Velocity sample, n=115 |
| Spas replying to at least half of reviews | 65.2% | Velocity sample, n=115 |
Source: State of Med Spa Google Presence 2026 (Google Business Profile data collected September 2026; aggregates only; velocity and reply figures come from a verified subsample, see the methodology).
How to use the benchmarks
- Review velocity: if you add fewer than about 6 reviews a month, you are below the median spa in our sample. Fix the ask (every patient, same moment, one-tap link) before anything else. Our guide to getting more Google reviews explains how, and how many new reviews a month is normal has the detail.
- Reply rate: replying to every review is a cheap advantage when about a third of spas reply to fewer than half. Replies must not confirm anyone is a patient (HIPAA-safe review replies; should med spas reply to reviews?).
- Rating: with an average of 4.87, small drops matter. Watch the 90-day rating as well as the lifetime figure.
- Local comparison: city figures differ a lot. Use med spa benchmarks by city or the Google review benchmark checker.
What we found when we studied 555 US med spas on Google
Patients praise the care almost without exception. The one area where complaints outnumber praise is booking and communication, and that is where most med spas can win.
Full study · 555 US med spas across 20 metros · roughly ±4% nationally · review velocity and themes from a 115-spa subsample · verified against raw data.
Building the dashboard without exposing patient data
Short answer: a marketing dashboard needs counts, not people. Pull aggregates out of clinical systems, and keep identifiable information inside tools covered by the right agreements.
- Decide whether HIPAA applies. Med spas that bill health plans electronically are usually covered entities; many cash-only spas are not. Either way, state health privacy laws (Washington's My Health My Data Act, for example) and the FTC Act can apply to health information, so treat it carefully regardless.
- Export aggregates from the booking system: weekly counts of bookings by source, attended visits, rebookings, cancellations and booked hours. No names, phone numbers or treatment notes in the dashboard.
- Sign BAAs where needed. If any reporting, call tracking or CRM tool receives identifiable patient information and HIPAA applies, it needs a Business Associate Agreement. Ichelon Consulting US signs a BAA with every US client.
- Keep health details away from ad platforms. HHS guidance on online tracking technologies warns that sending protected health information to tracking vendors without a BAA or authorization can violate HIPAA. Don't fire treatment-specific events to ad pixels, and get legal advice before uploading patient lists for ad matching. See our HIPAA-safe tracking guide.
- Small numbers are identifying. A weekly report showing one patient booked for a rare treatment from a small town is effectively a record. Group small categories.
- Limit access. Give marketing staff and agencies the dashboard, not log-ins to the EMR.
The Monday review: a 30-minute routine
Short answer: a dashboard is only useful if someone acts on it. Review it at the same time every week with the people who can change the numbers.
- Pacing against goals: are bookings, attended consultations and reviews on track for the month?
- One leak: pick the KPI furthest below goal and agree one action (for example, reminder timing to fix show rate).
- Channel check: cost per booked consultation by channel; move budget gradually toward the best.
- Reputation: new reviews, unanswered reviews, any negative review needing a HIPAA-safe reply.
- Capacity: next two weeks' utilization by provider; plan campaigns for empty days.
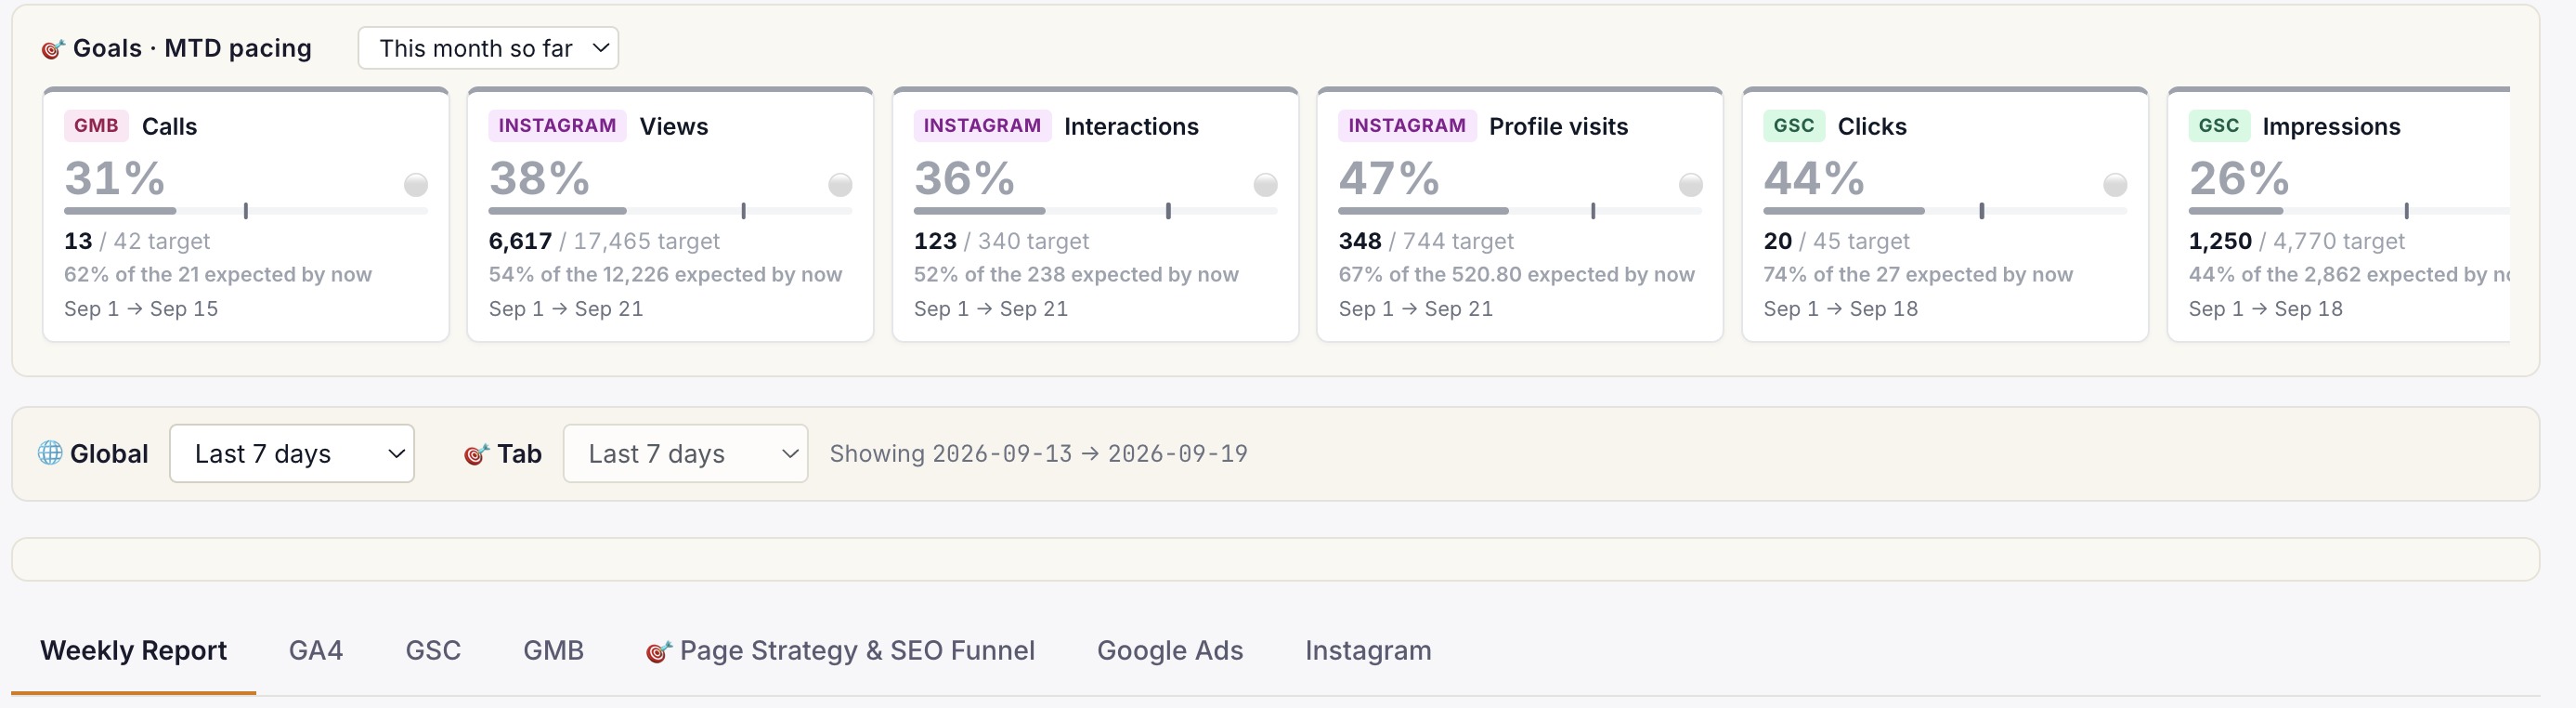
Ichelon Consulting US agrees monthly goals with each client and tracks them live on Ichelon Agency OS, with a report every Monday. Our marketing technology stack guide covers the systems behind each number. More guides are in the US guides library and research in the US research library. See how we work or book a call.
Sources
- Ichelon Consulting US: State of Med Spa Google Presence 2026 and methodology
- HHS OCR: Use of online tracking technologies by HIPAA covered entities and business associates
- HHS: Business associate contracts
- Washington RCW 19.373: My Health My Data Act
- Google Business Profile Help: Performance and insights
Note: general information, not legal advice. Whether HIPAA applies to your med spa, and what you can share with marketing vendors, depends on your billing and structure; confirm with counsel.
Related pages from the US team
Med spa marketing technology stack
The systems behind each KPI, by category.
Med spa membership marketing guide
Churn, credit usage and retention routines.
New med spa launch plan
What to measure from 120 days out to month six.
Med spa marketing statistics 2026
The benchmark numbers behind this guide.
How many new reviews a month is normal?
Review velocity in detail.
Med spa marketing agency USA
How Ichelon Consulting US runs med spa marketing.
Every practice welcome — Goals-Driven engagements from $499/mo
We benchmark your last 90 days, agree monthly goals with you, and track them live on Ichelon Agency OS with a report every Monday. Performance-Linked Payout Models are available. Our US leadership is based in Dallas, and strategy calls run in US business hours.
Common questions
What KPIs should a med spa track?
Weekly: bookings by source, show rate, consult-to-treatment rate, rebooking rate, provider utilization, new Google reviews, review reply rate, average rating and cost per booked consultation for paid channels. Monthly: membership churn, revenue per patient and cost per attended consultation by channel.
How do you calculate med spa show rate?
Show rate is appointments attended divided by appointments scheduled for the period, excluding appointments cancelled with enough notice to refill. Track it separately for new consultations and for returning patients, because the causes and fixes differ.
What is a good review velocity for a med spa?
In our study of US med spas, the median spa in our review-velocity sample of 115 added about 6 new Google reviews a month. Compare yourself with competitors in your own city as well, and aim for steady weekly reviews rather than bursts.
How do you measure cost per booked consultation?
Divide ad spend for a channel by the consultations booked from that channel in the same period. Booking source needs to be captured at booking, through tracked booking links, call tracking or a required "how did you hear about us" field. Cost per attended consultation, using attended visits instead of bookings, is the stricter and more useful version.
Can a med spa dashboard be HIPAA compliant?
Yes, if it reports aggregates (counts, rates, totals) rather than patient records, and if any tool that does receive patient information is covered by a Business Associate Agreement where HIPAA applies. Avoid sending treatment or health details to ad platforms through pixels or audience uploads without a legal review.
How often should a med spa review its KPIs?
Weekly for operating numbers such as bookings, show rate, utilization and reviews, and monthly for slower measures such as membership churn, revenue per patient and channel-level acquisition costs. A fixed weekly meeting with one owner per metric works better than a dashboard nobody opens.
A note on this guide: it explains marketing practice, not legal advice. Rules on privacy, advertising and insurance change and vary by state, so confirm anything compliance-related with your own counsel.
Want a weekly dashboard tied to booked visits?
Book a 30-minute benchmarking call. A member of our Sr. Leadership team will review your last 90 days and show you which numbers to watch first.