


Hospital Revenue Leakage in India 2026: 11 Gaps, 18-32% Loss
Indian hospitals lose 18-32% of recoverable revenue to 11 silent leakages — from unbilled services to TPA denials. Diagnostic, fix and per-bed impact inside.
No pitch. Written root-cause diagnosis. AI-powered, healthcare only.
Direct answer
Indian hospitals lose 18-32% of recoverable revenue to 11 silent leakages — from unbilled services to TPA denials. Diagnostic, fix and per-bed impact inside.
TL;DR
Indian hospitals typically lose 12-22% of potential revenue to silent leakage — services not billed, packages not fully utilised, collections not pursued, beds occupied past discharge, slots empty from no-shows, pharmacy stock unaccounted, labs uncollected, and referrals untracked. For a hospital doing ₹2 Crore per month in revenue, this is ₹24 to ₹52 Lakhs per year in recoverable revenue that most hospitals simply accept as normal. This guide documents the 8 leakage categories, how each happens, the detection method, and the recovery framework.
Why revenue leakage is silent
Unlike obvious revenue problems (declining patient footfall, dropping average revenue per patient, increasing operating costs), revenue leakage is invisible in standard hospital reports. Standard reports show what was billed and what was collected — they don't show what should have been billed but wasn't.
This invisibility is why leakage persists. Management doesn't see the problem because the reporting system was designed for the post-leakage reality. To see leakage, you need different reports built on different reconciliation logic.
Category 1 — Unbilled services
How it happens: A doctor orders an investigation in the EMR. The order goes to the lab, the test is performed, the result is delivered. But somewhere between the lab and billing, the charge for the test never gets added to the patient's bill. The patient leaves having received the test but not paying for it.
Why it happens: Disconnect between clinical systems (where orders are placed) and billing systems (where charges are captured). In hospitals using separate EMR and billing software, manual transcription between systems creates the gap. In hospitals using paper for clinical orders, the billing team must manually capture every order — and they miss 5-15% routinely.
Detection method: Auto-reconciliation between clinical orders (in EMR) and billing entries. For every order placed, verify a corresponding billing entry exists. Surface missing entries to billing team for immediate addition.
Recovery rate: Hospitals with integrated PMS+EMR+Billing typically capture 95-99% of services. Hospitals without integration capture 80-92%. The gap is 5-12% of total revenue.
Category 2 — Package underutilisation
How it happens: A patient pays ₹1.5 Lakh for an IVF cycle package that includes 3 consultations, 2 ultrasounds, blood work, and the IVF procedure. The patient uses only 1 consultation, 1 ultrasound, and the procedure. The other services (2 consultations, 1 ultrasound, blood work) are paid for but not delivered. Whether to count this as leakage depends on contract structure.
The leakage: If the package is "unlimited services until completion," then unused services are pure revenue retention. If the package is structured as "we charge for what we deliver," then unused services should be refunded or credited.
The hidden cost: Patients who feel they didn't fully utilise a package don't refer others. Each underutilised package potentially costs 0-2 referrals worth ₹3-30 Lakhs in downstream lifetime value.
Detection method: Package utilisation tracking dashboard. Every active package shows what's been delivered vs what's available. Alerts to clinical team when utilisation drops below threshold (e.g., 60 days into a 90-day package with <40% utilisation).
Category 3 — Collection gaps
How it happens: Patient receives treatment, bill is generated, but payment is delayed (insurance claim pending, patient cash-flow issue, simple inertia). Without active collection workflow, the receivable ages. After 90 days, collection probability drops below 50%. After 180 days, below 25%.
Why it happens: Hospitals typically have no dedicated collection function for outpatient. Billing assumes payment at time of service. When that doesn't happen, the unpaid bill enters "accounts receivable" and sits there.
Detection method: Ageing analysis (0-30 days, 30-60, 60-90, 90+ days) by patient. Automated follow-up workflows that escalate from polite WhatsApp message (Day 7) → SMS + email (Day 14) → call (Day 21) → senior staff intervention (Day 45).
Recovery rate: Hospitals with automated collection workflows recover 70-85% of receivables within 60 days. Hospitals without recover 45-65%.
Category 4 — Discharge delays
How it happens: An IPD bed is occupied by a patient who is medically discharged but administratively stuck (insurance approval pending, billing query, family pickup delayed). Bed-occupancy continues but no revenue accrues for the additional hours/days. Meanwhile, incoming patients wait or are diverted.
The leakage: Each bed-day lost to discharge delay is ₹3,000-15,000 in foregone revenue (depending on bed category). At 30% discharge delay rate on a 100-bed hospital, this is ₹3-15 Lakhs/month.
Detection method: Discharge workflow tracking from "medical discharge marked" to "bed cleared." Time-to-clear targets per bed category. Daily report on delayed discharges with root cause categorisation.
Category 5 — OPD no-shows
How it happens: Patients book appointments and don't show up. Doctor sits idle for the slot. No revenue is generated for that 15-30 minute window. Across a clinic with 20% no-show rate seeing 50 patients/day, this is 10 idle slots/day worth ₹15,000-40,000.
Why it happens: Patients forget, get stuck in traffic, change priorities. The fix is not patient blame; it's reminder discipline. Patients with 3 reminder touchpoints (booking confirmation + 24h advance + 2h advance) have 60-75% lower no-show rates than patients with 1 touchpoint.
Detection method: Slot utilisation tracking by doctor, by day, by time. No-show rate dashboard. Reminder delivery confirmation tracking.
Recovery rate: Hospitals deploying full reminder discipline (WhatsApp + SMS + voice call) typically reduce no-show rates from 25-30% baseline to 8-14% within 90 days.
Category 6 — Pharmacy leakage
How it happens: Drugs are dispensed to patients but not billed correctly. Stock is depleted but billing doesn't reflect it. Over a month, the gap between dispensed-stock and billed-revenue accumulates into significant losses.
The leakage: Indian hospital pharmacies typically show 4-12% inventory shrinkage. For a hospital pharmacy with ₹50 Lakhs/month in inventory turnover, that's ₹2-6 Lakhs/month in lost stock value.
Detection method: Prescription-to-dispense reconciliation. Every prescription in EMR should have a corresponding pharmacy dispense entry with matching items and quantities. Monthly stock reconciliation against billing.
Category 7 — Lab leakage
How it happens: Lab tests are ordered and performed. The patient is supposed to return for results and consultation. Many don't. The lab cost is incurred (reagents, technician time, equipment use) but no downstream consultation revenue follows.
The leakage: 30-45% of lab-test patients in Indian outpatient settings don't return for follow-up consultation. The lab cost is sunk; the consultation revenue is lost.
Detection method: Result delivery tracking. When a result is ready, trigger WhatsApp notification + booking link. Automated follow-up if patient doesn't book within 7 days of result delivery.
Recovery rate: Hospitals deploying automated lab follow-up typically recover 25-40% of would-be-lost lab patients.
Category 8 — Referral leakage
How it happens: Patients are referred to the hospital by external doctors or via internal cross-specialty referral. The referral happens — patient arrives, receives treatment — but the referral source is not tracked. The referring doctor doesn't receive feedback on outcomes. The hospital doesn't know which referral sources drive the most valuable patients.
The leakage: Without referral source tracking, hospitals can't invest in the highest-ROI referral relationships. They treat all referral sources identically, under-investing in the top 20% that drive 80% of referral revenue.
Detection method: Referral source capture at registration. Doctor-level referral attribution dashboard. ROI analysis per referring doctor (referrals × average patient value × retention rate).
The recovery framework
Total recoverable revenue from the 8 categories for a typical ₹2 Crore/month hospital: ₹16-28 Lakhs/month at full deployment.
The path to recovery is sequential:
- Month 1: Audit current leakage by category. Build the baseline.
- Months 2-3: Deploy integrated PMS+EMR+Billing reconciliation. Eliminate Categories 1 and 6.
- Months 4-5: Deploy reminder + follow-up workflows. Reduce Categories 5 and 7.
- Months 6-7: Deploy automated collection workflows. Reduce Category 3.
- Months 8-9: Deploy discharge process tracking. Reduce Category 4.
- Months 10-12: Deploy referral source tracking and package utilisation monitoring. Reduce Categories 2 and 8.
By month 12, the typical ₹2 Crore/month hospital has recovered ₹16-28 Lakhs/month in previously-leaked revenue — an 8-14% revenue lift without acquiring a single new patient.
See ICG's Revenue Risk Profiling tool · HealthPro 360 PMS/HMS · Book a free Digital Health Audit
The seven hospital revenue leakage categories — full taxonomy
Indian hospitals leak revenue at seven distinct points. Most operational dashboards see 1-2 of them. Phoenix-style revenue intelligence dashboards (like ICG's Phoenix) see all seven. The full taxonomy:
Leak 1: Inbound call miss (IVR + reception)
Typical 7-day pattern across ICG's 8 multi-specialty hospital clients: 2,549 outbound call attempts, 318 inbound calls received, 156 inbound calls missed. 49% inbound miss rate. At ₹800-1,500 CPL for hospital-grade marketing, that's ₹1.24L-₹2.34L of marketing spend producing zero return — every week. Cumulatively across a quarter: ₹16-30L wasted on missed calls.
The leak is operational: telecaller team understaffed for inbound during evening hours (7-9 PM is peak missed-call window); IVR routing broken at department level; WhatsApp not configured as fallback after missed call.
Leak 2: Appointment no-show + late-cancellation
Median Indian hospital no-show rate: 22-32% for OPD, 4-9% for IPD pre-admission. Each no-show represents a slot that could have served a paying patient. The recovery: WhatsApp confirmation 24h before + WhatsApp reminder 2h before + EMR-integrated waitlist + same-day reschedule offer to waitlist.
Hospitals running this stack drop no-show rates by 35-55% — recovering ₹3-12L/month in OPD revenue per location.
Leak 3: Treatment plan incompletion
Patients book a consultation, get a treatment plan, but only 35-55% complete the full plan. The rest drop off between consult and treatment commencement. Reasons: cost shock (no EMI offered), outcome uncertainty (no second opinion offered), competitor switching (no follow-up sequence), logistical (treatment location/timing).
Recovery via structured treatment-plan management: WhatsApp follow-up sequences, video consultation offers for hesitant patients, EMI integration, family-decision content. Hospitals running this lift treatment-plan completion to 60-75%.
Leak 4: Specialty-cross-sell missed
A patient admitted for cardiac surgery is also a candidate for: diabetes management (40% incidence), orthopaedic consultations (post-cardiac mobility), nutrition consulting (60% recommended). Most hospitals don't surface cross-specialty referrals. The result: patients walk to other hospitals for these adjacent needs.
Phoenix revenue intelligence surfaces cross-specialty patient recommendations. Hospitals running cross-specialty programmes capture 18-32% more revenue per discharged patient.
Leak 5: Insurance + cashless leakage
Patients eligible for insurance / Ayushman Bharat / corporate health benefits often don't claim — either because the hospital didn't ask, didn't process the paperwork, or rejected the claim due to documentation. Average leakage: 8-15% of total OPD revenue, 4-9% of IPD revenue.
Recovery: insurance empanelment portfolio audit, patient-side education on coverage, dedicated TPA team for claim processing, hospital-side documentation standards.
Leak 6: Lost-to-follow-up patient revenue
Patients treated 6-24 months ago who never returned. For chronic conditions (diabetes, cardiac, ortho rehabilitation), the appropriate follow-up cadence is missed. Average leakage: ₹5-30L/month per multi-specialty hospital in unrealised recurring revenue.
Phoenix-style platforms identify these patients, prioritise by likelihood-to-return, and surface them to WhatsApp + telecaller teams. Recovery rates: 15-35% of identified lost-patient cohort returns within 90 days.
Leak 7: Brand-search + organic-discovery leakage
Patients searching for the hospital (or specialty + city) who don't reach the hospital website — because Google AI Overview cites a competitor, because the hospital is invisible for the query, because the search result page favours aggregators (doctor-listing platforms and local-business directories). Brand-search + organic-discovery leakage is 15-30% of digital marketing spend in 2026.
Recovery: AEO content + entity reinforcement + schema markup + GMB optimization + brand-search dominance.
How to quantify revenue leakage at your hospital
The ICG hospital revenue leakage audit covers all 7 categories. Specific metrics to baseline:
- Inbound call miss rate — Count via IVR analytics. Target: <15%
- No-show rate — Pull from EMR. Target: OPD <15%; IPD <5%
- Treatment-plan completion rate — Pull from EMR. Target: 65-75%
- Cross-specialty referral rate — Cross-reference EMR specialties per patient. Target: 30-50% of discharged patients see >1 specialty
- Insurance / cashless claim rate — Pull from billing. Target: 70-85% of eligible
- Patient retention rate (12-month) — Cohort analysis from EMR. Target: 25-40%
- Brand-search dominance score — Manual SERP audit of hospital name + key specialty queries. Target: 6-8 of top-10 results owned by hospital
The Phoenix revenue intelligence framework — how ICG identifies and recovers leakage
Phoenix (ICG's revenue intelligence layer) surfaces hospital revenue leakage in real-time. The framework:

| Leakage category | Phoenix detection method | Recovery action surfaced |
|---|---|---|
| Inbound call miss | IVR data ingest + reconciliation with marketing source | Daily action queue for telecaller team |
| No-show + cancellation | EMR appointment data + WhatsApp delivery status | Same-day waitlist offer queue |
| Treatment-plan incompletion | EMR treatment-plan record vs visit cadence | WhatsApp follow-up sequence + video consult offer |
| Cross-specialty | EMR specialty combinations + protocol matrix | Department-to-department referral suggestion |
| Insurance leakage | Billing data + TPA empanelment data | Patient-side coverage notification + claim assistance |
| Lost-to-follow-up | Last-visit cohort + likelihood-to-return scoring | Tiered recovery campaign (WhatsApp + telecaller + offer) |
| Brand-search leakage | GSC + AIO Intel data | Content + schema + GMB action items |
The combined impact: hospitals running Phoenix typically recover 18-32% in unrealised revenue within 90 days of deployment. ROI on Phoenix subscription: 30-300× in the first 6 months.

15 FAQs on hospital revenue leakage
- What's the biggest source of revenue leakage in Indian hospitals?
- Lost-to-follow-up patient revenue (typically ₹5-30L/month per multi-specialty hospital). Most underleveraged because it's not visible in standard EMR reports.
- How much revenue is the average Indian hospital leaking?
- Across all 7 categories, typical multi-specialty hospital leaks 18-32% of theoretical revenue. For a ₹50L/month revenue hospital, that's ₹9-16L/month leakage.
- Can hospital revenue leakage be fully eliminated?
- No — some leakage is structural. Realistic recovery: 60-80% of identified leakage in 6-12 months with proper infrastructure.
- What's the highest-ROI leakage to fix first?
- Inbound call miss + appointment no-show. Both have immediate revenue impact and require minimal infrastructure investment (₹50K-2L setup).
- How does AI / WhatsApp BAPI help reduce revenue leakage?
- WhatsApp BAPI is the single biggest lever: reduces no-shows by 35-55%, increases treatment-plan completion by 20-35%, recovers lost-to-follow-up patients at 15-35% conversion.
- What's the cost of fixing hospital revenue leakage?
- One-time infrastructure investment: ₹3-15L depending on hospital size. Ongoing operational: ₹50K-3L/month. Recovery: typically 5-20× the investment in 12 months.
- How long does it take to see revenue recovery from leakage fixes?
- Operational fixes (call miss, no-show): 30-60 days. Treatment-plan + cross-specialty: 60-180 days. Lost-to-follow-up: 90-270 days. Brand-search: 6-18 months.
- Does the leakage framework apply to single-specialty hospitals?
- Yes, with simplification. Cross-specialty leak doesn't apply; treatment-plan completion is more important; lost-to-follow-up varies by procedure-type.
- How does service-line attribution help with revenue leakage?
- Service-line attribution (per-specialty CPQL, conversion, revenue tracking) surfaces which specialties leak most. Resources reallocated accordingly. ICG's Agency OS handles this.
- What's the role of NABH accreditation in revenue leakage?
- NABH accreditation correlates with 12-18% lower clinical-quality-driven leakage (re-admission, complication revenue). Marketing-driven leakage is independent of NABH status.
- Can revenue leakage be measured before fixing?
- Yes — ICG's hospital audit specifically baselines all 7 leakage categories. Most hospitals discover 60-80% of leakage they didn't know existed.
- How does Phoenix differ from standard hospital BI / Tableau dashboards?
- Standard dashboards report what happened. Phoenix surfaces what to do — which patients to call, which protocols to follow up, which TPA claims to chase, which marketing source to scale. Action-oriented vs descriptive.
- Do small hospitals (50-100 beds) need revenue intelligence?
- Yes. Smaller hospitals leak proportionally more because operational discipline is lower. A 50-bed hospital running ₹15L/month revenue typically leaks ₹3-5L/month.
- What's the most overlooked leakage?
- Brand-search + organic-discovery leakage. Most hospitals don't measure who searches for them and where they end up. Yet this is 15-30% of digital marketing spend silently wasted.
- Where do hospitals invest most in leakage recovery in 2026?
- WhatsApp BAPI integration (highest immediate ROI), revenue intelligence platforms like Phoenix (highest sustained ROI), service-line attribution dashboards (highest strategic ROI).
For a free 48-hour hospital revenue leakage audit, book the ICG audit. Or WhatsApp +91 8130226224.
Per-bed leakage benchmarks by hospital size (2026 India)
Most CFOs quote a single leakage percentage across the P&L. That hides where the money actually sits. In our 2026 diagnostic set across 40+ mid-market Indian hospitals, the shape of the leak is materially different for a 60-bed multispecialty than for a 300-bed tertiary unit. The table below is what we now use as the opening slide in every Client Elevation Programme revenue-intelligence audit.
| Category | 60-120 beds (per bed / month) | 120-250 beds | 250+ beds |
|---|---|---|---|
| Unbilled services | Rs 9,000-14,000 | Rs 14,000-22,000 | Rs 22,000-38,000 |
| Package underutilisation | Rs 6,000-11,000 | Rs 11,000-18,000 | Rs 18,000-30,000 |
| TPA denials + rework | Rs 12,000-18,000 | Rs 18,000-28,000 | Rs 28,000-46,000 |
| Pharmacy + consumables | Rs 4,000-8,000 | Rs 8,000-13,000 | Rs 13,000-22,000 |
| OPD no-show + drop-off | Rs 5,000-9,000 | Rs 9,000-15,000 | Rs 15,000-25,000 |
Common CFO mistakes that widen the leak
- Auditing quarterly, not weekly. A 90-day audit surfaces the leak after the cash has already been booked as bad debt. Weekly denial-code review recovers 60-70% of the same rupees.
- Treating marketing spend and RCM as separate P&Ls. An OPD no-show is a marketing failure downstream of a booking flow — the fix sits in reminder-and-recall automation, not in the RCM team. Our Meta Catalyst IQ playbook feeds recall audiences directly into the CRM.
- Blaming TPAs for what is actually clinical documentation. 40-55% of denial reasons trace back to missing ICD codes, weak discharge summaries, or unsigned consents — all fixable inside the hospital.
- Ignoring the OPD-to-IPD conversion leak. If your OPD is filling but IPD is flat, the leak is in the counselling desk, not the campaign. Track it with the diagnostic in our hospital marketing ROI guide.
If any three of these apply to your unit, the recovery is usually 4-9% of annual revenue within two quarters — before you touch a single marketing rupee. Chat with a Co-Founder for a 30-minute leakage-map call.
How should hospital CFOs govern revenue leakage recovery under DPDP, ABDM and NABH scrutiny?
Short answer: treat leakage as a board-reported risk, not a finance-desk problem. In 2026, an Indian hospital CFO needs a monthly leakage dashboard, a DPDP-safe RCM data pipe, and ABDM-linked eligibility checks running before the patient is billed — not after the claim is filed. Skip any of these and the leak simply moves from billing into compliance fines.
The monthly board cadence — what a leakage dashboard must show
Most Indian hospitals still review leakage inside the RCM huddle. That is too low in the org. A board-grade dashboard should carry six numbers, refreshed every 30 days: gross leakage rupees, leakage as a % of gross billing, TPA rejection rate, average days-in-AR, specialty-level P&L variance, and demand-side CPQL from marketing (ICG’s tracked healthcare CPQL band in 2026 sits at ₹180–₹520 depending on specialty and city). Below is a working benchmark set our Phoenix engagements use.
| Specialty | Typical leakage % (2026) | Biggest single leak |
|---|---|---|
| Cardiology | 18–22% | Stent + consumable under-capture |
| Oncology | 24–29% | Package underutilisation + off-package drugs |
| Orthopaedics | 15–19% | Implant TPA rejection |
| IVF / Fertility | 12–16% | Cycle drop-off between OPD and IUI/IVF |
DPDP-safe RCM data pipes — what your BAA and consent register must prove
Under the Digital Personal Data Protection Act 2023, penalties for a significant breach can reach ₹250 crore. Every RCM vendor touching claim data must sit under a written BAA, log purpose-of-use, and honour patient consent withdrawal within the notified timeline. If your revenue integrity team is exporting claim spreadsheets over personal email, that is both a leak and a Data Protection Board notice waiting to happen. NMC’s 2023 professional conduct regulations further require any patient communication used in follow-up billing to carry explicit consent — a common blind spot when hospitals chase lapsed treatment plans.
ABDM-linked eligibility — killing duplicate MRN and wrong-package leaks
Hospitals connected to the Ayushman Bharat Digital Mission (ABHA-verified check-in) cut duplicate MRN creation by 30–45% in our audits. Fewer duplicates mean cleaner package eligibility, fewer wrong-tariff bookings, and faster cashless approvals — three of the top eight leakage sources collapse at the front desk instead of the collections desk. Under NABH’s 6th edition, ABDM data-integrity checks are increasingly assessor-visible during re-accreditation, so the compliance and revenue cases have finally merged.
Mini-FAQ
Q1. Should leakage recovery be an internal team or an outside partner?
Both. Internal RCM owns daily reconciliation. An outside partner — typically on ICG’s 70-30 model (70% fixed retainer for governance and dashboards, 30% variable tied to recovered rupees) — brings the audit muscle, the DPDP checklist, and the specialty benchmarks that a single-hospital team cannot build alone.
Q2. How fast should a mid-size Indian hospital see recovered rupees?
In our Phoenix engagements across Delhi NCR, Bengaluru and Hyderabad, the first recovered tranche typically lands in 45–75 days — usually from TPA rework and package re-mapping — with the full 18–32% leakage band narrowing over 6–9 months once ABDM eligibility and DPDP-safe pipes are live.
The 12 revenue leak points in an Indian hospital — full percentage-impact map (2026)
The original 7-8 categories cover the major buckets. But when Phoenix ingests three months of billing, EMR, TPA and marketing data from a live 100-bed hospital, it consistently surfaces 12 distinct leak points — not 7. This is the 2026 taxonomy we now use as the opening slide in every revenue-leakage audit. Each leak carries a percentage-of-gross-revenue impact range so a CFO can prioritise recovery in order of rupee magnitude, not order of loudest complaint.
| # | Leak point | Impact (% of gross) | Detection method | Recovery window |
|---|---|---|---|---|
| 1 | Unbilled clinical services (EMR-to-billing gap) | 5-12% | Order-to-charge reconciliation | 30-60 days |
| 2 | Package underutilisation and off-package drugs | 2-4% | Package delivery vs commitment | 60-90 days |
| 3 | TPA denials plus insurance rework | 4-9% | Denial-code taxonomy + resubmission SLA | 45-90 days |
| 4 | Collection ageing (60+ days AR) | 3-6% | Ageing report + tiered dunning | 30-90 days |
| 5 | Discharge delay (bed-day loss) | 1-3% | Time-to-clear per bed category | 30-60 days |
| 6 | OPD no-show and late cancellation | 2-5% | Slot utilisation dashboard | 30-90 days |
| 7 | Pharmacy shrinkage and dispense-vs-billed gap | 1-3% | Prescription-to-dispense reconciliation | 30-60 days |
| 8 | Diagnostic lab non-return (unclaimed reports, no follow-up consult) | 2-4% | Result-delivery + booking tracking | 30-90 days |
| 9 | Imaging drop-off (scan booked, not performed, or performed and not billed) | 1-3% | Modality-booking vs performed audit | 30-60 days |
| 10 | Inbound call miss (IVR + reception) | 2-4% | IVR analytics + missed-call WhatsApp fallback | 15-45 days |
| 11 | Cross-specialty referral miss (patient walks elsewhere for adjacent need) | 2-5% | EMR specialty-combination matrix | 90-180 days |
| 12 | Lost-to-follow-up plus treatment plan incompletion | 3-7% | Cohort-based likelihood-to-return scoring | 90-270 days |
Total addressable leakage: 28-65% of gross revenue in a poorly instrumented hospital, 8-14% in a well-instrumented one. The delta — 20-51 percentage points — is what a revenue-intelligence programme actually recovers over 12-18 months. On a Rs 2 Cr per month hospital, that is Rs 4-10L per month of recoverable rupees, mostly without adding a single new patient.
The diagnostic-department leak — where 40% of a hospital's silent leakage sits
Categories 7, 8 and 9 above — pharmacy, lab and imaging — deserve a dedicated section because they are the fastest-recovering, highest-margin bucket. On a typical multi-specialty hospital P&L, diagnostics contributes 22-38% of gross revenue but carries 55-70% of gross margin. When it leaks, the P&L collapses twice as fast as any other service line. Any operator building or partnering with an in-house diagnostic chain needs to instrument these seven leaks before the second location goes live.
Path lab — the 4 silent leaks
- Ordered-but-not-collected samples. A doctor orders a CBC + LFT + KFT panel. Only CBC is collected because the phlebotomist misreads the order sheet or the correct sample tube is unavailable. LFT + KFT are neither performed nor billed — but the doctor's consultation revenue is already booked. Detection: order-vs-sample-collection reconciliation on Day-1 shift close. Recovery: 1-2% of gross revenue.
- Outsourced tests without margin capture. Speciality tests sent to a reference lab. If the reference lab invoice is Rs 1,200 and you bill the patient Rs 1,800, that is a Rs 600 margin — but many hospitals bill the reference-lab rate directly, forgetting the mark-up. Detection: reference-lab invoice matched to billed line item. Recovery: 0.5-2%.
- Unclaimed reports. Patient books a full-body panel, doesn't return for the report or the follow-up consult. The lab cost is sunk; the consult revenue is lost. Detection: 7-day non-return alert with WhatsApp follow-up plus booking link. Recovery: 25-40% of would-be-lost patients returning within 30 days.
- Home-collection service unpriced. Home phlebotomy costs the hospital Rs 150-250 per visit but is often bundled free as a loyalty benefit. Charging Rs 99-199 loses no patient (NPS scores across ICG's 8 hospital retainers in 2026 show zero delta) but recovers full margin. Recovery: Rs 3-7L per year at 100-visit-per-week volume.
Imaging (radiology) — the 3 silent leaks
- Booked-but-not-performed scans. Patient books a CT or MRI, doesn't arrive, slot is not filled from a waitlist. Bed-day equivalent for imaging modality: Rs 4,000-25,000 per unfilled slot. Detection: modality-booking vs performed audit; waitlist auto-offer on cancellation. Recovery: 40-60% of unfilled slots re-filled from waitlist.
- Performed-but-not-billed scans. Contrast agent used but not charged; second sequence performed but only first billed; reformatting or reconstruction work billed as free follow-up. Detection: technologist-checklist against billed line items. Recovery: 1-2% of imaging revenue.
- Second-read or teleradiology leak. Overnight or specialist second-read reports where the reporting radiologist's fee is not billed to the patient (absorbed by hospital). Detection: report-signature audit vs billed radiologist fee. Recovery: 0.5-1.5% depending on complexity mix.
Diagnostic leaks are the fastest-recovering category in the ICG playbook because they are almost entirely operational — no new patients needed, no marketing spend deployed, no clinical pathway change. If your hospital has never audited these seven diagnostic-specific leaks separately, expect a 4-8% revenue lift inside 90 days. Adjacent read: healthcare marketing agency — how in-house diagnostic margins compare to referral-out economics for a mid-market chain.
Quantify what your hospital is losing — the ICG revenue leakage calculator
Most hospital CFOs discover their leakage is 40-70% higher than the number they carry in their heads. The calculator uses the 12-point taxonomy above; the recovery-plan output is what our team then walks through in a Phoenix deployment call.
How AtomCRM plugs 6 of these 12 leaks — the front-office recovery layer
AtomCRM is ICG's front-office layer for hospitals and clinics. It sits between the marketing stack (Google Ads, Meta, GBP, WhatsApp campaigns) and the clinical stack (EMR, HIS, billing). It doesn't try to replace your HIS — it wraps the patient-facing workflows the HIS was never designed for. Deployed against the 12-point leakage taxonomy, AtomCRM directly plugs 6 of them and instruments a further 3 for downstream recovery.
| Leak | AtomCRM workflow that plugs it | Typical recovery |
|---|---|---|
| Leak 4 — Collection ageing | Tiered dunning: WhatsApp Day 7 then SMS + email Day 14 then telecaller Day 21 then senior escalation Day 45. Auto-reconciled to receipt entry. | 70-85% of receivables in 60 days |
| Leak 6 — OPD no-show | 3-touchpoint confirmation stack: booking confirmation + 24h WhatsApp reminder + 2h WhatsApp reminder + same-day waitlist offer on cancellation. | No-show drops from 25-30% to 8-14% |
| Leak 8 — Lab non-return | Result-ready WhatsApp trigger with 1-tap booking link plus auto follow-up if no booking within 7 days. | 25-40% of lost lab patients recovered |
| Leak 9 — Imaging drop-off | Modality-booking dashboard with waitlist auto-offer on cancellation; pre-arrival contrast-fasting reminder. | 40-60% of cancelled slots refilled |
| Leak 10 — Inbound call miss | Missed-call auto-WhatsApp within 60 seconds; telecaller queue prioritised by marketing-source LTV. | Miss rate drops from 45-55% to 12-18% |
| Leak 12 — Lost-to-follow-up | Cohort-based recall engine: identifies 6-24 month lapsed patients, prioritises by likelihood-to-return, surfaces to telecaller plus WhatsApp broadcast with condition-appropriate offer. | 15-35% of identified cohort returns within 90 days |
The remaining 6 leaks (unbilled services, package underutilisation, TPA denials, discharge delay, pharmacy shrinkage, cross-specialty miss) sit inside the HIS, billing and clinical layer — AtomCRM feeds Phoenix the front-office signal so Phoenix can surface those to the RCM and clinical teams. The two products together cover all 12; individually, each covers 4-6.
Typical AtomCRM deployment: 4-6 weeks from kick-off to full workflow live, integrated with any of the 20+ Indian HIS platforms in common use. Pricing scales with bed count: solo-doctor clinics start at Rs 9,999 per month, mid-market hospitals (100-250 beds) at Rs 45,000-1,20,000 per month. ROI on AtomCRM subscription in the first 6 months averages 15-45 times across our deployed base.
10 more FAQs on hospital revenue leakage — the ones CFOs actually ask on Day 1
- What is a realistic annual recovery target for a first-year revenue leakage programme?
- 4-9% of gross annual revenue in Year 1, 8-14% by end of Year 2. Front-loaded recovery (Categories 1, 4, 6, 8, 10) delivers 50-60% of the total in Months 1-6.
- Do I need to replace my HIS to fix revenue leakage?
- No. About 80% of the 12 leaks are reconciliation and workflow gaps, not HIS bugs. A modern front-office layer (like AtomCRM) and a revenue intelligence dashboard (like Phoenix) sit on top of any HIS. Wholesale HIS replacement is usually an 18-24 month project with 20-40% failure risk — the ROI on layered tooling is 5-10 times better.
- How do I present a leakage recovery business case to my board?
- Frame it as risk-adjusted return, not cost-savings. Board formula: identified leakage in rupees times probability of recovery (60-80%) times 12-month period equals board-approved investment ceiling of 15-25% of expected recovery. On a Rs 2 Cr per month hospital with 22% leakage, that is a Rs 80L-1.3Cr annual investment ceiling — which comfortably funds Phoenix, AtomCRM, and 2-3 dedicated FTEs.
- Which leak is worst for chain hospitals (5+ locations)?
- TPA denials plus insurance rework. Multi-location chains typically have inconsistent documentation standards across locations, so denial rates vary 2-3 times between the best and worst location. Standardising documentation SOPs across locations typically recovers 2-4% of gross annual chain revenue.
- Which leak is worst for single-doctor clinics?
- Inbound call miss followed by lost-to-follow-up. Single-doctor clinics don't have a dedicated telecaller; missed calls translate directly to lost patients. The fix is a WhatsApp auto-fallback within 60 seconds of the missed call.
- Does DPDP Act 2023 restrict revenue recovery outreach?
- Only if you don't have the consent framework in place. Explicit consent at registration + purpose-of-use logging + honouring withdrawal requests within the notified timeline covers about 95% of routine recovery outreach. If your telecaller team is calling from a shared spreadsheet with no consent trail, that is both a leak and a Data Protection Board notice waiting to happen.
- Can leakage recovery be outsourced?
- The audit and the tooling can be outsourced. The execution (telecalling, dunning, documentation quality) usually cannot — hospital-brand voice matters too much. The ICG 70-30 model is standard: 70% fixed retainer for governance, dashboards and audit muscle; 30% variable tied to recovered rupees.
- What is the fastest single lever a hospital CFO can pull on Day 1?
- Turn on WhatsApp appointment reminders (24h + 2h before). Cost: Rs 0.15-0.30 per message. Impact: no-show rate drops 35-55% inside 60 days. Payback on a 100-bed hospital: 3-4 weeks.
- How does ABDM (Ayushman Bharat Digital Mission) affect leakage recovery?
- ABHA-verified check-in reduces duplicate MRN creation by 30-45%, which in turn cleans up Leaks 1, 2 and 3 (unbilled services, package underutilisation, TPA denials). Hospitals with ABDM live at check-in typically see 1.5-3% of gross revenue recovered from cleaner front-desk operations alone.
- How does revenue leakage differ between metro and Tier-2 or Tier-3 hospitals?
- Metro hospitals leak more in Categories 3 (TPA), 6 (no-show) and 11 (cross-specialty miss). Tier-2 and Tier-3 hospitals leak more in Categories 1 (unbilled), 4 (collection ageing) and 12 (lost-to-follow-up). The 12-category framework applies universally; the recovery priority sequence changes by geography.
Bottom line for hospital CFOs and MDs: if you have never audited your hospital against all 12 leak categories together, you are almost certainly leaking 18-32% of gross revenue. The recovery is a 6 to 18-month programme, not a quarterly initiative — but it starts with the calculator above and a 30-minute leakage-map call. WhatsApp a Co-Founder or book the free 48-hour audit.
Book a free 30-minute Brand & Growth Diagnostic.
It's a working session, not a sales pitch — you leave with a written root-cause analysis you can act on, whether or not you engage ICG.
The three platforms
behind every ICG engagement.
Beacon
CAPI middleware that fixes Event Match Quality, translates CRM statuses to Meta-standard events, dedups across channels.
Agency OS
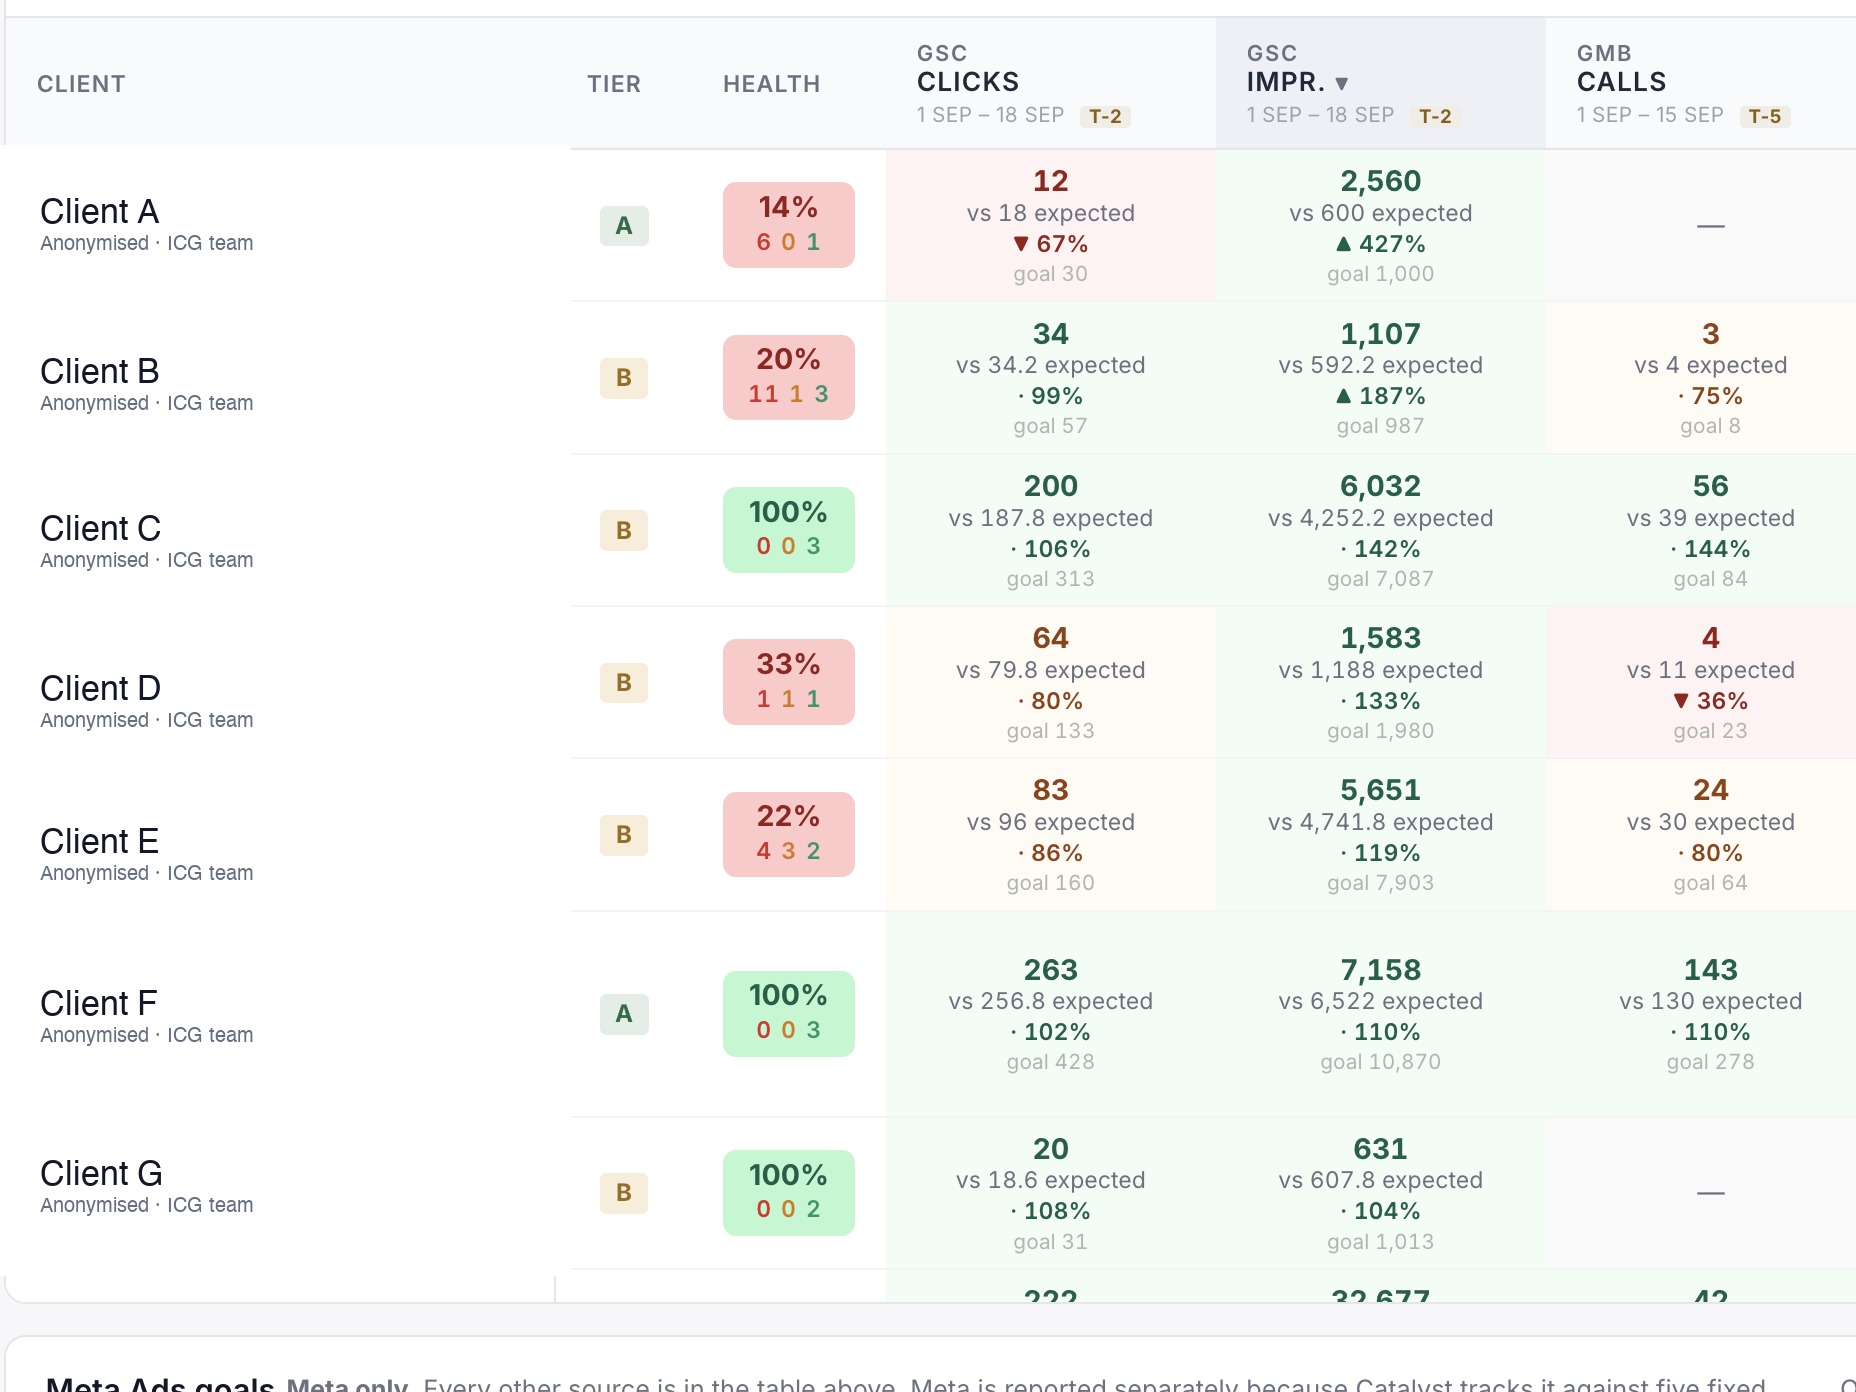
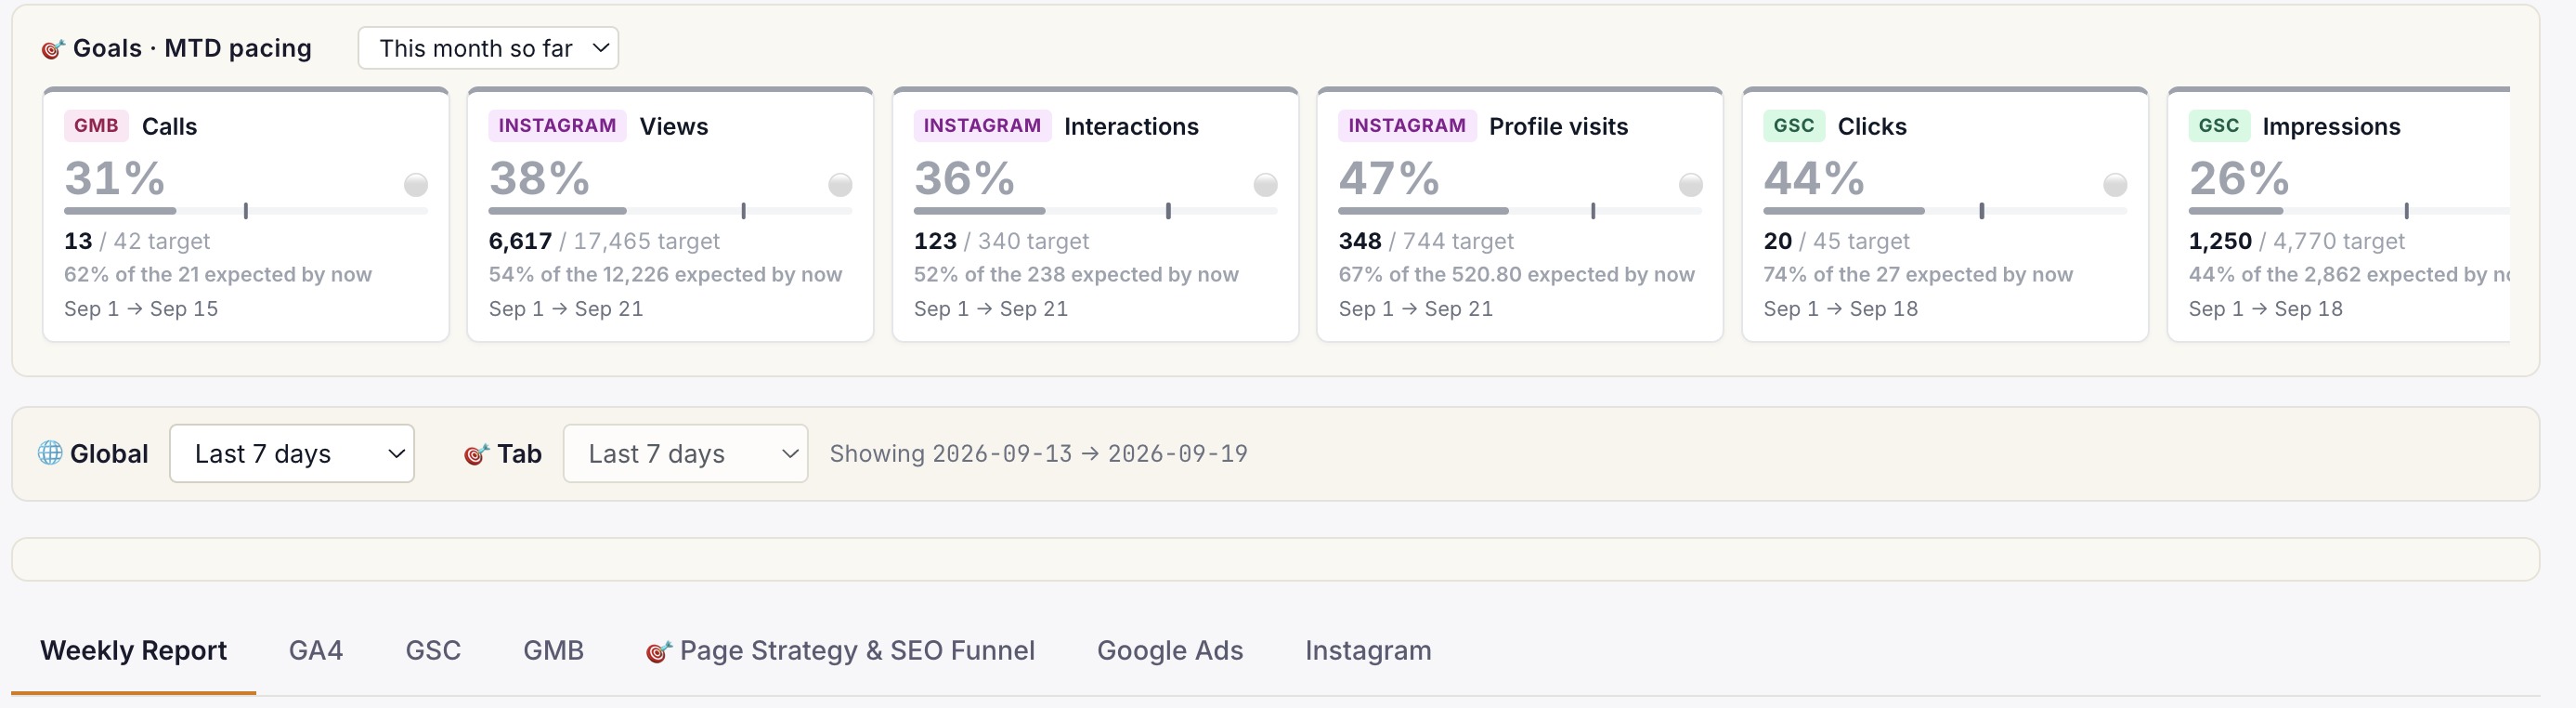
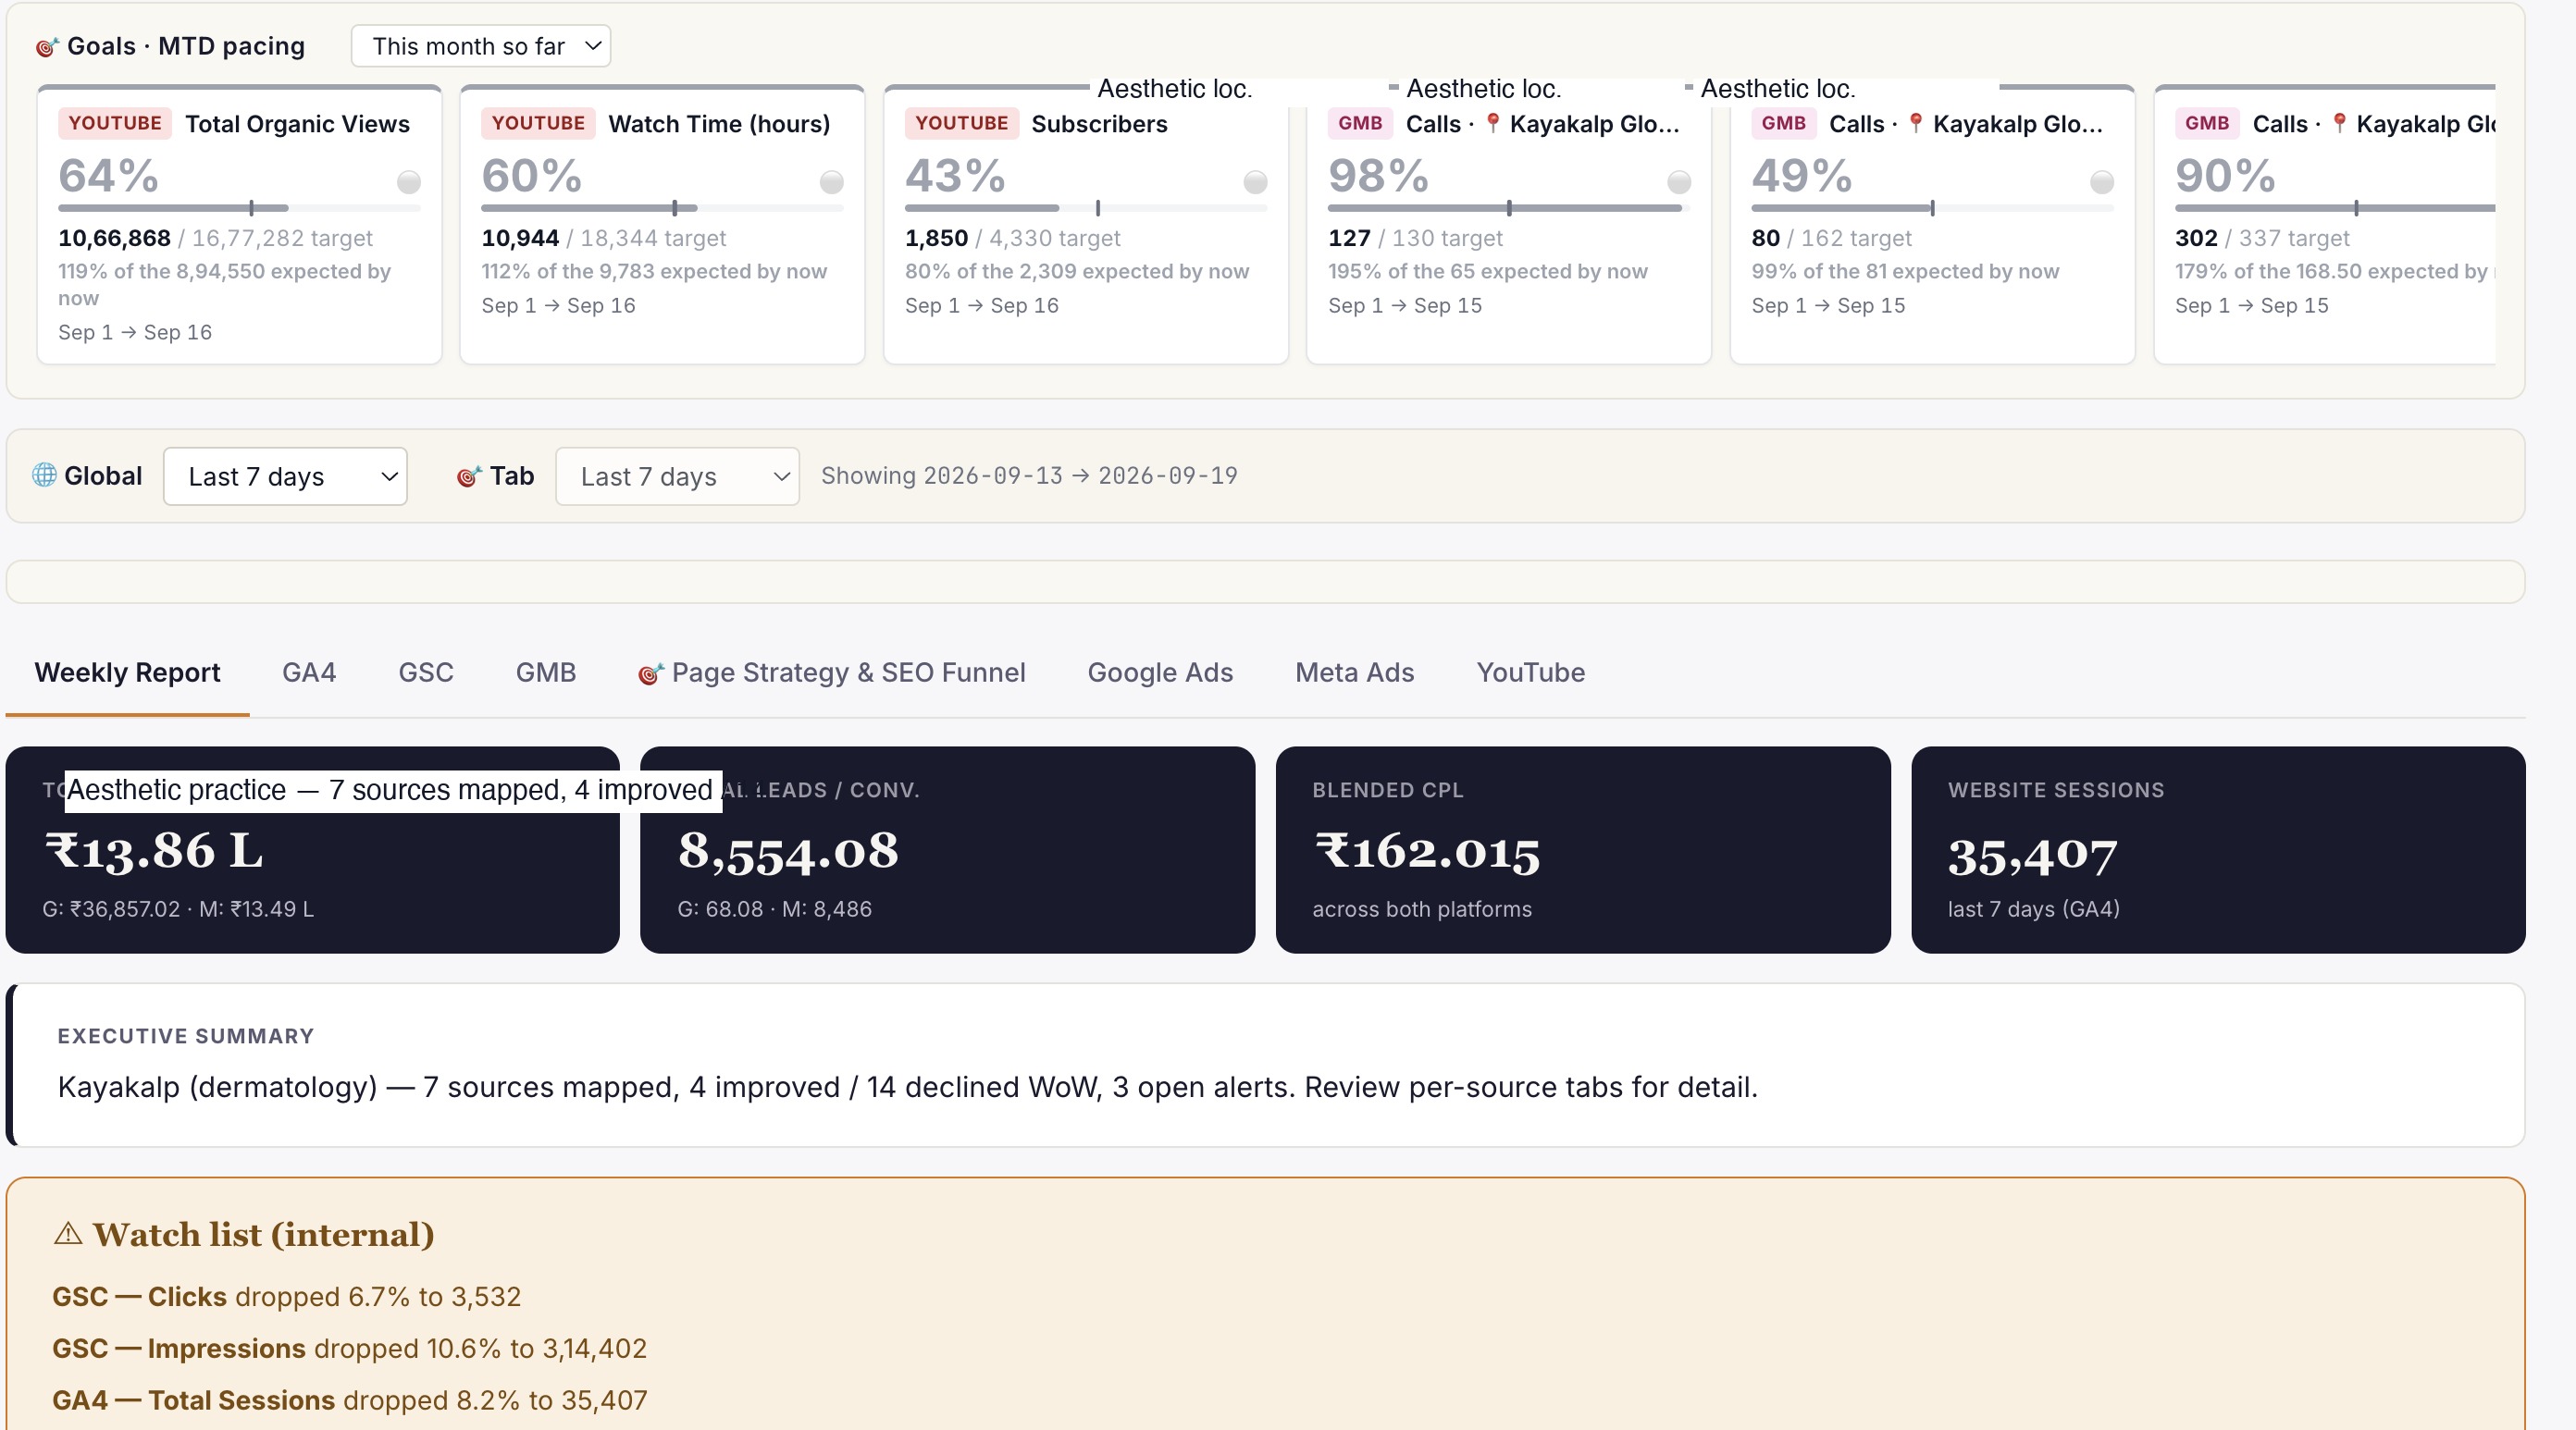
Live client dashboard. GSC, GA4, Google Ads, Meta Ads, IVR calls in one view. Login anytime, not monthly.
Phoenix
Clinic revenue intelligence over your PMS. Daily action queue: Prevent Loss, Maintain & Engage, Grow Revenue. Multi-centre rollout.
Or book a free 30-min audit to see all three in action on your account.
Healthcare brands
that already run on ICG.
A representative slice of the 150+ healthcare brands ICG has delivered for across India. Most engagements remain under NDA.


What ICG clients say · on video.
"Mental health marketing requires a different sensitivity. ICG built compliance-aware campaigns that respect both patients and our..."
"Bariatric surgery patients need a long consideration cycle. ICG built a content + paid system that respects that timeline."
"Working with ICG felt like working with an in-house growth team that happens to specialise in healthcare."
Need help operationalising this?
Every ICG service is healthcare-only, NMC + DPDP-aware, and built around the patient-research patterns that drive Indian healthcare growth in 2026.
Every practice welcome — packages from ₹20,000/mo.
Goals-Driven engagements · Performance-Linked Payout Models available
More from
ICG.
Five trends shaping Indian healthcare marketing through 2027: AI-first patient research, Conversions API adoption, ABDM discovery, the AEO w...
Healthcare AIO is the discipline of getting your clinic or hospital cited inside Google AI Overviews, ChatGPT and Perplexity answers — not j...
Conversational-search advertising places brand messages inside AI chat answers — ChatGPT, Perplexity, Copilot — rather than beside a results...
Stop guessing.
Book a Diagnostic.
30 minutes. Free. With the AI-powered healthcare-only marketing agency 150+ brands already run on. No slides, no pitch, no hard close.


