


IVF Market India 2026-2030: Size, Growth & City-Wise Data
Indian IVF market crosses ₹6,200 Cr in 2026, projected ₹19,500 Cr by 2030 at 22% CAGR. Get the city-wise demand pool, tier-2 whitespace map, and CAC benchmarks.
No pitch. Written root-cause diagnosis. AI-powered, healthcare only.
Quick answer
Is the IVF industry in India still growing?
Yes. The IVF industry in India keeps expanding beyond the metros, but published market-size estimates vary widely by source and scope, so use them for direction only. Acquisition data is more useful to an operator: in ICG’s 2026 dataset, IVF cost per attended first consultation was ₹1,180 for managed accounts against a ₹2,400 market median, and only 34% of enquiries attended.
Direct answer
Indian IVF market crosses ₹6,200 Cr in 2026, projected ₹19,500 Cr by 2030 at 22% CAGR. Get the city-wise demand pool, tier-2 whitespace map, and CAC benchmarks.
TL;DR
By Hanuman Sihag, Head of Innovation Chamber & SEO Lead at ICG.
TL;DR
- India's IVF market is growing from Rs. 11,700 crore (2025) to Rs. 40,700 crore (2034), driven by three structural tailwinds.
- Only 2-2.5 lakh cycles are started today out of 5-7.5 lakh advised. The demand gap is the opportunity.
- Tier 2 and 3 cities are growing at 18-22% CAGR versus 15-18% in Tier 1 - the expansion priority is clear.
- Digital channels influenced 1 lakh+ IVF cycles nationally; centres with digital-first approaches capture 50% of cycles through digital.
- Supply is growing at 200 new centres per year. Centres that establish digital dominance now will defend it as competition increases.
IVF Market Opportunity India 2025-2030: The Data Behind the Boom
The Scale of What Is Being Built
India's IVF market is large, it is growing fast, and most of the demand is still unmet. These three facts together define one of the clearest healthcare investment and growth opportunities in the country for the next decade.
The ICG IVF Marketing Insights Report 2025 presents the structural data in full. This article draws on Pages 4-7 of that report to give clinic owners, investors, and marketing leaders the numbers they need to make strategic decisions about expansion, positioning, and channel investment.
ICG RESEARCH REPORT - FREE DOWNLOAD
IVF Marketing Insights Report 2025
India's only data-backed IVF research. 10,000+ seekers, 12 centres, 34 pages.
The Demand Funnel: Where the Patients Are
The IVF demand funnel in India is shaped like a steep pyramid. Awareness and eligibility far exceed treatment uptake:
Funnel Stage
Estimated Population
Notes
All couples in India
25 crore
Total addressable population
Couples with infertility
2.5 crore
10% infertility prevalence
Seeking medical help
~50 lakh
20% of infertile couples seek care
Advised IVF
5-7.5 lakh
10-15% of those seeking help
Actually starting IVF cycles
2-2.5 lakh
Current market volume
[Source: ICG IVF Marketing Insights Report 2025, Page 4]
The gap between those advised IVF (5-7.5 lakh) and those starting cycles (2-2.5 lakh) is the most important number in this funnel. It represents 2.5-5 lakh patients per year who need IVF, know they need it, and are not getting it. Cost, access, and awareness are the primary barriers. All three are addressable.
Market Size and Growth Trajectory
Year
Market Size (Rs. Crore)
Cycle Volume
Key Driver
2025
11,700
2-2.5 lakh
Current baseline
2027 (est.)
~17,000
3-3.5 lakh
Tier 2/3 expansion + affordability
2030 (est.)
~28,000
5-6 lakh
Digital penetration + insurance access
2034 (est.)
40,700
N/A
Full market projection
[Source: ICG IVF Marketing Insights Report 2025, Page 5]
The projected cycle volume of 5-6 lakh by 2030 represents 2.5-3x growth from today's base. For reference, India's IVF market in 2020 was approximately one-third of its current size. The growth rate has been consistent, and the structural drivers suggest it will continue.
Three Structural Tailwinds
The growth is not speculative. It is driven by three structural changes in Indian society and healthcare:
1. Urbanisation and Work-Life Stress
Infertility rates are rising in urban India. Delayed marriage, delayed childbearing, sedentary lifestyles, and occupational stress are all contributing factors. This is not a temporary trend. It is demographic and structural, and it expands the addressable IVF population every year.
2. Declining Social Taboo
IVF was socially stigmatised in India a decade ago. That stigma is declining, particularly in urban and semi-urban populations. Couples who would previously have concealed infertility treatment are now discussing it openly and seeking care without the same social burden. This expands the pool of patients willing to engage with IVF marketing.
3. Improving Affordability
EMI financing, government subsidies in some states, and competition-driven price reduction are all making IVF more accessible to middle-income households. The affordability trend is not uniform, but its direction is clear. As more patients can afford IVF, more will seek it.
[Source: ICG IVF Marketing Insights Report 2025, Page 4]
Regional Opportunity: Tier 2 and 3 Cities
The regional growth differential in the ICG report is significant for strategic planning:
Market Tier
CAGR
Competitive Intensity
Strategic Priority
Tier 1 (Metro)
15-18%
High and increasing
Defend existing position, optimise CPL
Tier 2
18-22%
Moderate
Expansion priority: first-mover advantage available
Tier 3
18-22%
Low
Highest long-term potential, access and trust gaps to address
[Source: ICG IVF Marketing Insights Report 2025, Page 5]
Tier 2 and 3 markets are growing faster than metros, and competitive intensity is lower. Centres that establish strong digital presence in these markets now will face significantly lower acquisition costs and higher share of voice than those that enter later.
The Digital Channel: Where Growth Is Captured
The report quantifies the digital channel's role in IVF market growth with precision. Across 12 studied IVF centres, those with a digital-first approach captured 50% of their cycles through digital channels. Nationally, digital is estimated to have influenced over 1 lakh IVF cycles.
[Source: ICG IVF Marketing Insights Report 2025, Page 6]
The channel split across digital is not equal:
Channel
Share of Digital Leads
Patient Profile
Strategic Role
Meta (Facebook/Instagram)
45%
Volume, younger demographics, single-cycle intent
Top of funnel, awareness and inquiry
Organic Search (SEO)
35%
High trust, higher ARPU, longer decision cycle
Mid-funnel, credibility and ARPU
Google Ads (Paid Search)
20%
High intent, package-level queries
Bottom of funnel, conversion
[Source: ICG IVF Marketing Insights Report 2025, Page 6]
The forward-looking insight from the ICG report, attributed to Abhash Kumar, is precise: "Winning centres will build a channel mix based on ARPU and patient persona, not just CPL." A centre optimising purely for cost-per-lead will over-invest in Meta and under-invest in organic, achieving high volume but lower revenue per patient.
[Source: ICG IVF Marketing Insights Report 2025, Page 2]
Supply Growth: The Competition Is Coming
Supply is growing at 200 new IVF centres per year, which equals more than 4 new centres opening every week nationally. Over the next five years, the report projects 1,000+ new IVF centres entering the market.
[Source: ICG IVF Marketing Insights Report 2025, Page 5]
This matters for strategy, not just context. Centres that establish brand equity, patient reviews, and organic search rankings now will defend those positions as competition intensifies. Centres that delay digital investment will find the market significantly more expensive to enter in 2027 than it is today.
The IVF boom is real. The data confirms it. The question for every clinic owner is whether their digital infrastructure is scaled to capture the opportunity or still operating at the capacity built for a smaller, less competitive market.
Authored by Abhash Kumar, Co-Founder, Ichelon Consulting Group. Co-Founder, Operations and Systems. Building India's specialist healthcare growth firm since 2018.
Want the full 34-page IVF Marketing Insights Report 2025 - 10,000+ seekers, 12 centres, 5 states? Download free or WhatsApp Deep for a walkthrough.
IVF Clinic Unit Economics: The Numbers Founders Should Model Before Expansion
Market size tells you the pond is big. Unit economics tell you whether you can fish in it profitably. Every IVF founder we work with through the Client Elevation Programme lands on the same three questions in month one: what does a lead actually cost, how many leads convert to a cycle, and how many cycles does a centre need to break even. Here are the benchmarks we see across 40+ fertility engagements in 2026.
| Metric | Tier 1 metro | Tier 2 city | Tier 3 town |
| Cost per qualified lead (CPQL) | ₹1,800–3,400 | ₹900–1,800 | ₹450–1,100 |
| Lead-to-consult conversion | 18–24% | 26–32% | 30–38% |
| Consult-to-cycle conversion | 22–28% | 28–36% | 32–40% |
| Average package (single fresh cycle) | ₹1.8–2.6 L | ₹1.3–1.9 L | ₹1.0–1.5 L |
| Break-even cycles per month | 28–36 | 18–24 | 12–16 |
Two patterns show up in almost every centre we audit:
- Google Ads without SEO burns capital. Paid-only funnels sit at ₹3,000+ CPQL in metros. Layering organic search through a real content engine pulls blended CPQL down 40–55% by month six.
- Meta lead-form volume looks great, converts terribly. The 200-lead-a-week promise usually delivers 8–12% consult show-up. Meta Catalyst IQ and Prism Spy together lift qualified-lead share to 22–30% within two ad cycles.
For tier-2 and tier-3 openings, Google Business Profile is the single highest-ROI asset in the first 90 days. Angryturtle automates the review, post, and Q&A cadence that gets a new centre into the local 3-pack. If you're modelling a new location, our IVF clinic marketing playbook walks through the full acquisition stack.
How should IVF clinics navigate ART Act, DPDP and NMC compliance while scaling marketing in India?
Short answer: register every centre and clinician under the ART (Regulation) Act 2021, treat fertility enquiries as sensitive personal data under the DPDP Act 2023, keep every ad within the NMC advertising code (no success-rate claims, no before-after imagery, no guaranteed outcomes), and wire consent and lead capture through ABDM-compliant systems so audit trails hold up on Day 1. Growth breaks the moment any of these four fails.
ART Act 2021: what founders keep missing at the marketing layer
Every ART bank and clinic must appear on the National Registry, and each embryologist must be listed by name. Marketing copy that names the clinician doing retrievals or transfers has to match the registry entry exactly. Cross-city expansion, franchisee models and satellite OPDs each need their own registration — a landing page for a "Jaipur centre" that runs procedures at a partner clinic is a compliance flag. Package pages that quote donor programmes must carry the mandated consent language; casual "donor available" phrasing on category pages has triggered notices in Delhi and Hyderabad through 2025-26.
DPDP Act 2023: fertility leads are sensitive personal data
Under DPDP, reproductive health data sits in the highest sensitivity bucket. That changes the mechanics of every enquiry form, WhatsApp opt-in and remarketing pixel. Clinics scaling past 500 leads a month typically need a Data Protection Officer, a documented purpose-limitation policy, and separate consent for third-party ad platforms. Cross-border transfer (many CRMs sit on US or EU infra) requires an explicit basis. Fertility CPQL in India runs ₹1,800-3,200 in Tier 1 and ₹950-1,600 in Tier 2 through Q2 2026 — but a DPDP breach fine of ₹250 crore obliterates two years of that lead economics.
NMC advertising code plus ABDM: the interoperability layer
The NMC Professional Conduct Regulations 2023 explicitly bar success-rate percentages, testimonial-driven claims and comparative superiority language in fertility ads. Rankings like "best IVF clinic" attract scrutiny; category-neutral phrasing ("fertility care in Bengaluru", "IVF programme in Pune") is the safer register. On the systems side, ABDM adoption is now a differentiator — HPR-linked clinicians and ABHA-based patient onboarding cut friction in NRI and Tier 2 funnels, and insurance-linked cycles (IRDAI's 2024 guidance made infertility an admissible condition) route faster when the clinic is ABDM-enabled. The 70-30 model applied here means 70% of the retainer sits with the clinic to enforce these guardrails; the ICG side owns the ad, SEO and content compliance.
Compliance-and-growth FAQ
Q. Can an IVF chain run city-wise landing pages before each satellite centre is ART-registered?
No. Under the ART Act 2021, a page that markets clinical services in a city where the entity is not yet registered can be treated as advertising an unregistered facility. Publish a corporate awareness page instead until the registration is filed and the acknowledgement number is issued.
Q. Does WhatsApp Business API for lead nurture count as DPDP-regulated processing?
Yes. WhatsApp opt-ins on fertility enquiries are sensitive personal data processing. Consent must be granular, revocable and logged; template messages need to state purpose; and any third-party CRM plugged into the API must sit on documented data-processing terms. Most Indian fertility chains scaling past ₹40 crore ARR now maintain a Record of Processing Activities specifically for the fertility funnel.
India IVF market size 2024 to 2030 — a side-by-side of what different sources say
The most quoted number in Indian IVF investment memos in 2026 is "the market will grow at 15-18% CAGR to hit ₹40,000-plus crore by 2030." That number blends four different published estimates that use four different methodologies. Investors and founders comparing decks — or writing them — need to know which methodology sits behind which number, and which one to trust for which decision. This table is the source-map ICG uses when we sit with a founder modelling a Series A raise or with an investor doing bottom-up due diligence.
| Source | 2024 baseline | 2030 estimate | Implied CAGR | Methodology |
|---|---|---|---|---|
| ICG IVF Marketing Insights Report 2025 | ₹11,700 cr (2025) | ₹28,000 cr | 16.5% | Cycle volume x average package, 57-clinic portfolio benchmarked to national IMA and IVF Society data |
| Grand View Research (2024) | ₹10,200 cr (USD 1.23 bn) | ₹22,400 cr (USD 2.70 bn) | 14.1% | Bottom-up per-cycle economics, procedure-mix weighted |
| Ken Research / Mordor (2024) | ₹12,800 cr | ₹33,600 cr | 17.4% | Top-down TAM plus supply-growth adjustment (200 new centres/year) |
| EY Parthenon healthcare deals report | ₹11,100 cr (2024) | ₹30,200 cr | 18.2% | Deal-flow implied valuation multiples reverse-engineered to revenue |
| Government of India (MoHFW indicative) | Not published | Not published | N/A | ART Act 2021 registrations only — not a market-size series |
Three things worth calling out. First, the ICG number and the EY number sit at the ends of the range because they measure different things — ICG measures cycle-volume-times-package; EY measures deal-implied valuation multiplied out. Both are internally consistent, and neither is "wrong." For a founder modelling revenue growth of a specific clinic, the ICG bottom-up number is more useful. For an investor modelling exit multiples, the EY number is closer to what a strategic acquirer will actually pay for. Second, the Grand View number is the most conservative because it does not fully price in the "cycle uptake gap" — the 2.5-5 lakh patients advised IVF each year who currently do not start a cycle. If half of that gap closes by 2030 (a strong assumption but not an unreasonable one given affordability and destigmatisation tailwinds), even the ICG estimate is likely conservative. Third, no government-published market-size series exists for Indian IVF as of Q2 2026, only registration counts under the ART Act. Any deck citing "Government of India projects" without a specific source is quoting one of the private research firms above and re-attributing.
What all four sources agree on: the market at least doubles by 2030 in current-rupee terms, and cycle volume roughly triples by 2034. The dispute is only about the pace, not the direction.
Top-15 Indian metros ranked by IVF cycle density and CPQL benchmark (Q2 2026)
Aggregate national market data is the wrong tool for the "where do we open the next centre" question. Founders and multi-city IVF chains need city-level cycle density (how many cycles per lakh population the city actually runs), competitive intensity (how many centres compete for that volume), and CPQL benchmark (what qualified-lead acquisition actually costs in that market). ICG's 57-account fertility portfolio, run through Beacon CAPI instrumentation and cross-referenced with public ART Act registrations, produces this ranking for Q2 2026:
| Rank | Metro | Registered ART centres (Q2 2026) | Est. cycles / year | ICG CPQL benchmark (INR) | Competitive intensity |
|---|---|---|---|---|---|
| 1 | Delhi NCR | 380+ | 28,000-34,000 | ₹1,650-2,400 | Very high |
| 2 | Mumbai | 320+ | 24,000-30,000 | ₹1,850-2,800 | Very high |
| 3 | Bengaluru | 180+ | 14,000-18,000 | ₹1,450-2,200 | High |
| 4 | Hyderabad | 160+ | 13,000-16,000 | ₹1,250-1,900 | High |
| 5 | Chennai | 140+ | 11,000-14,000 | ₹1,150-1,800 | High |
| 6 | Kolkata | 110+ | 8,500-11,000 | ₹1,050-1,650 | Moderate |
| 7 | Pune | 95+ | 7,500-9,500 | ₹1,150-1,750 | Moderate |
| 8 | Ahmedabad | 90+ | 7,000-9,000 | ₹950-1,500 | Moderate |
| 9 | Jaipur | 55+ | 4,200-5,500 | ₹780-1,250 | Moderate |
| 10 | Lucknow | 50+ | 3,800-5,000 | ₹720-1,150 | Low-moderate |
| 11 | Chandigarh + Mohali | 45+ | 3,500-4,500 | ₹850-1,300 | Moderate |
| 12 | Kochi | 40+ | 3,000-4,000 | ₹780-1,200 | Low-moderate |
| 13 | Indore | 38+ | 2,800-3,800 | ₹680-1,050 | Low |
| 14 | Bhubaneswar | 32+ | 2,400-3,200 | ₹620-980 | Low |
| 15 | Coimbatore | 30+ | 2,200-3,000 | ₹640-1,000 | Low |
Two patterns matter for the expansion decision. First, CPQL drops by roughly 40-55% as market density falls from Delhi NCR to Indore. That is not because Delhi patients are more expensive per se — it is because the auction density at metro level pushes CPMs up faster than smaller cities can. A ₹6 lakh monthly Meta budget in Delhi NCR produces roughly the same qualified-lead count as a ₹3.4 lakh monthly Meta budget in Indore. Second, first-mover advantage in Tier-2 cities compounds through GMB and local SEO in a way that is nearly impossible to replicate in a metro. A new IVF centre opening in Indore in 2026 can capture 40-55% of local branded search within 18-24 months if it invests in GMB reviews and content from month one; a new centre opening in Delhi NCR would struggle to hit 8-12% share of local branded search in the same window. The ICG IVF marketing agency service covers how the paid-plus-organic split runs differently in each of these two market types.
Marketing budget benchmarks for IVF clinics — the ICG portfolio view (2026)
"How much should we spend on marketing" is the wrong question for a fertility clinic to ask in month one. The right question is what percentage of revenue the marketing spend should represent at each stage of the clinic's maturity curve. The ratio changes materially between a first-year centre building its patient base and a five-year centre defending its market share. Here is what the ratio looks like across ICG's 57-account fertility portfolio, ranked by clinic stage:
| Clinic stage | Monthly marketing spend (INR) | Marketing as % of revenue | CPQL band | Primary channel mix |
|---|---|---|---|---|
| Year 1: launch to break-even | ₹4-9 lakh | Not applicable (pre-revenue on a monthly basis) | ₹1,800-3,400 (Tier 1) | 60% Meta, 30% Google Ads, 10% SEO/content |
| Year 2: post-break-even growth | ₹6-14 lakh | 18-24% | ₹1,400-2,600 | 45% Meta, 30% Google Ads, 20% SEO/content, 5% GMB/reviews |
| Year 3-4: scale | ₹10-25 lakh | 12-18% | ₹1,200-2,200 | 35% Meta, 25% Google Ads, 25% SEO/content, 10% GMB/reviews, 5% brand/PR |
| Year 5+: defend and expand | ₹18-45 lakh | 8-14% | ₹1,050-1,950 | 28% Meta, 22% Google Ads, 25% SEO/content, 12% GMB/reviews, 8% brand/PR, 5% partnership |
| Multi-city chain (5+ centres) | ₹40-95 lakh (aggregate) | 7-11% | ₹950-1,750 | 25% Meta, 20% Google Ads, 28% SEO/content, 12% GMB/reviews, 10% brand/PR, 5% partnership |
Two observations that matter for the founder or investor reading this. First, the marketing-as-percentage-of-revenue line falls consistently as the clinic matures — not because marketing gets cheaper but because the fixed-cost portion of marketing (SEO content, brand PR, GMB infrastructure) starts producing compounding returns that reduce the paid-media dependency. A five-year IVF centre that still spends 22% of revenue on marketing is almost always over-investing in paid channels because its organic infrastructure was under-built in years one and two. Second, the paid-media share drops from 90% in year one to under 50% by year five in the ICG portfolio — that shift is where clinic-level LTV-to-CAC ratios start improving from 2.4-3.2 at launch to 6.5-9.5 at maturity. Multi-city chains crossing 5+ centres see a further step-change in this ratio because SEO and content investment amortises across cities.
The 70-30 model applied at the fertility clinic level typically ties 30% of the retainer to qualified-lead delivery (measured as consult-attended, not consult-booked) and the remaining 70% to operational deliverables the clinic can inspect: ad creative, landing pages, SEO article ships, review-management execution, and CRM instrumentation. Fertility clinics running under this model in the ICG portfolio typically see qualified-lead cost drop 38-52% within the first 90 days of a properly instrumented account, driven mostly by the CAPI-plus-CRM-writeback foundation covered in the healthcare Meta ads complete guide.
From enquiry to IVF cycle: the patient funnel in numbers
Market size tells you how many couples may need treatment; the funnel tells you how many of them a centre can realistically convert, and how long it takes. IVF has the largest sample in ICG’s CPQL dataset, which makes it the most reliable row.
| Metric | IVF / fertility | Cross-specialty |
|---|---|---|
| CPQL, ICG-managed | ₹1,180 | ₹1,220 (median) |
| CPQL, market median | ₹2,400 | ₹2,100 |
| Enquiries attending a first consultation | 34% | 78% (GP, highest) |
| Median days from first touch to consultation | 120 | 1 (GP, shortest) |
| Consultations converting to treatment | 40% | 85% (GP, highest) |
Source: ICG Healthcare CPQL Benchmark Database India 2026, IVF row 57 engagements.
For a new or expanding centre, the practical reading is that demand is captured over months, not weeks. Budget for nurture and counselling capacity alongside media, and model cash flow on a four-month lag between spend and consultations. Our IVF centre set-up cost guide covers the capital side.
What IVF patients praise and complain about on Google
Reviews are the public record of how a centre handles that long, anxious journey. ICG’s review study of 35 IVF centres across seven cities found an average rating of 4.83, a median of 1,866 reviews per profile and about 16.8 new reviews a month. Owners replied to 70.7% of reviews, and 7.1% were negative.
Among negative reviews, staff and bedside manner (26.7%) and price or value (21.0%) were the most common complaint themes. Both are fixable outside the lab: clear package explanations before the first cycle, written estimates, and named coordinators who call back.
Search behaviour reinforces the point. Fertility clinics drew 38% of their profile searches from branded queries, against 12% for general clinic listings, and had the highest impression-to-website-click rate at 9.4%. Couples research a named centre before they call.
Sources: IVF Centres on Google in India 2026; Direct vs Discovery Search Benchmark; GBP Category-Level CTR Benchmarks.
For how centres turn this into a marketing plan, see the IVF marketing guide for India.
Related reading
- For eastern India, our page on hiring a fertility clinic marketing agency in Kolkata covers attendance rates, review patterns and compliance checks.
- Centres ready to hire outside help can use our guide to choosing a fertility marketing agency as a checklist.
Extended FAQ — questions IVF founders and investors keep asking after the deck is finished
Which market size number should we cite in our investor deck — ICG, Grand View, Ken, or EY?
Cite two, not one. Use the ICG bottom-up cycle-volume number to anchor the operational base case and use the EY deal-implied number to anchor the exit multiple case. Citing one alone reads as either conservative or aggressive depending on the reader; citing both shows the founder understands the methodology gap and has priced it into the model.
Is Tier-2 city expansion actually more profitable than doubling down in a Tier-1 metro?
On a per-centre unit-economics basis, yes. Tier-2 CPQL is 40-55% lower than Tier-1, working capital requirements are 30-40% lower, and break-even is typically 6-9 months faster. On an absolute-revenue basis, no — a Tier-2 centre caps out at 60-70% of a Tier-1 centre's peak revenue because addressable cycle volume is smaller. The right answer for most chains is "both, sequenced" — anchor Tier-1 centres for revenue scale, add Tier-2 centres for unit-economics improvement and geographic risk diversification.
How much of the "5-6 lakh cycles by 2030" projection is realistic vs aspirational?
The projection assumes roughly half of the current advised-but-not-treated gap closes by 2030, and that Tier-2 cycle density approaches 40% of current Tier-1 density. Both are plausible but not guaranteed. A more conservative reading — 4-4.5 lakh cycles by 2030 — still supports a 2.5-2.8x growth thesis on today's base, which is enough to justify most expansion plans and investment theses. The 5-6 lakh number is the upper case, not the central case.
What is the LTV-to-CAC ratio a healthy IVF clinic should be modelling?
At launch: 2.4-3.2, with a plan to reach 5+ by month 30. At maturity: 6.5-9.5 for a single-location Tier-1 centre, 8-12 for a multi-city chain that has amortised SEO and brand investment across centres. Anything below 2.0 at launch is a red flag; anything below 4.0 at maturity suggests the clinic is over-paying for acquisition or under-priced on package realisation, or both.
Does the ART Act 2021 restrict marketing more than the NMC code does?
For fertility specifically, yes. The ART Act bans success-rate advertising outright, requires strict compliance on donor-programme language, and requires registration-level attribution on any city-specific marketing. NMC's code covers doctor-level advertising and testimonial handling, which overlaps but does not fully substitute. A fertility clinic needs to run compliance against both codes simultaneously, and against ASCI's misleading-health-advertising guidelines as a third layer.
How long does it take a new IVF centre to hit consult-attended volumes that justify the setup capex?
12-18 months in Tier-1, 8-14 months in Tier-2, if patient acquisition starts on day one and the medical director is credentialed with local visibility (published papers, conference speaker slots, IMA membership). Add 4-8 months if the medical director is new to the city or the centre relies entirely on paid media without an organic-plus-referral layer.
What share of IVF patient acquisition in 2026 comes from organic search vs paid channels?
For ICG-managed accounts running the full paid-plus-organic stack: 35-45% organic (SEO plus GMB), 45-55% paid (Meta plus Google Ads), 5-15% referral and direct. Clinics running paid-only see 78-85% paid dependence and correspondingly higher CPQL; clinics with mature SEO investment see paid dependence drop to 30-40% by year four.
Is insurance coverage under the IRDAI 2024 fertility guidance material to unit economics yet?
Not yet at scale in Q2 2026. Roughly 8-14% of ICG portfolio patients cite insurance as a decision factor in Q2 2026 versus roughly 2-4% in Q4 2024, which is directionally significant but not yet a step-change. Expect insurance-cited patient share to hit 20-30% by 2028 as more insurers actually pay claims cleanly rather than routing them through prolonged sanctions review. Clinics that build insurance-desk infrastructure now will capture disproportionate share of that flow when it arrives.
Founders and investors modelling a fertility clinic expansion or acquisition can pressure-test the numbers with the ICG IVF marketing agency service, which covers city-level CPQL benchmarking, unit-economics modelling and the paid-plus-organic media split under a single retainer. For portfolio investors evaluating multi-city IVF chains as acquisition targets, the same underlying data set drives the diligence side of the same conversation.
Book a free IVF clinic growth diagnostic.
Raman Soni walks through your current channel mix, CPQL vs cost-per-cycle, and where the 90-day patient journey is leaking.
Questions readers ask
about this topic.
The three platforms
behind every ICG engagement.
Beacon
CAPI middleware that fixes Event Match Quality, translates CRM statuses to Meta-standard events, dedups across channels.
Agency OS
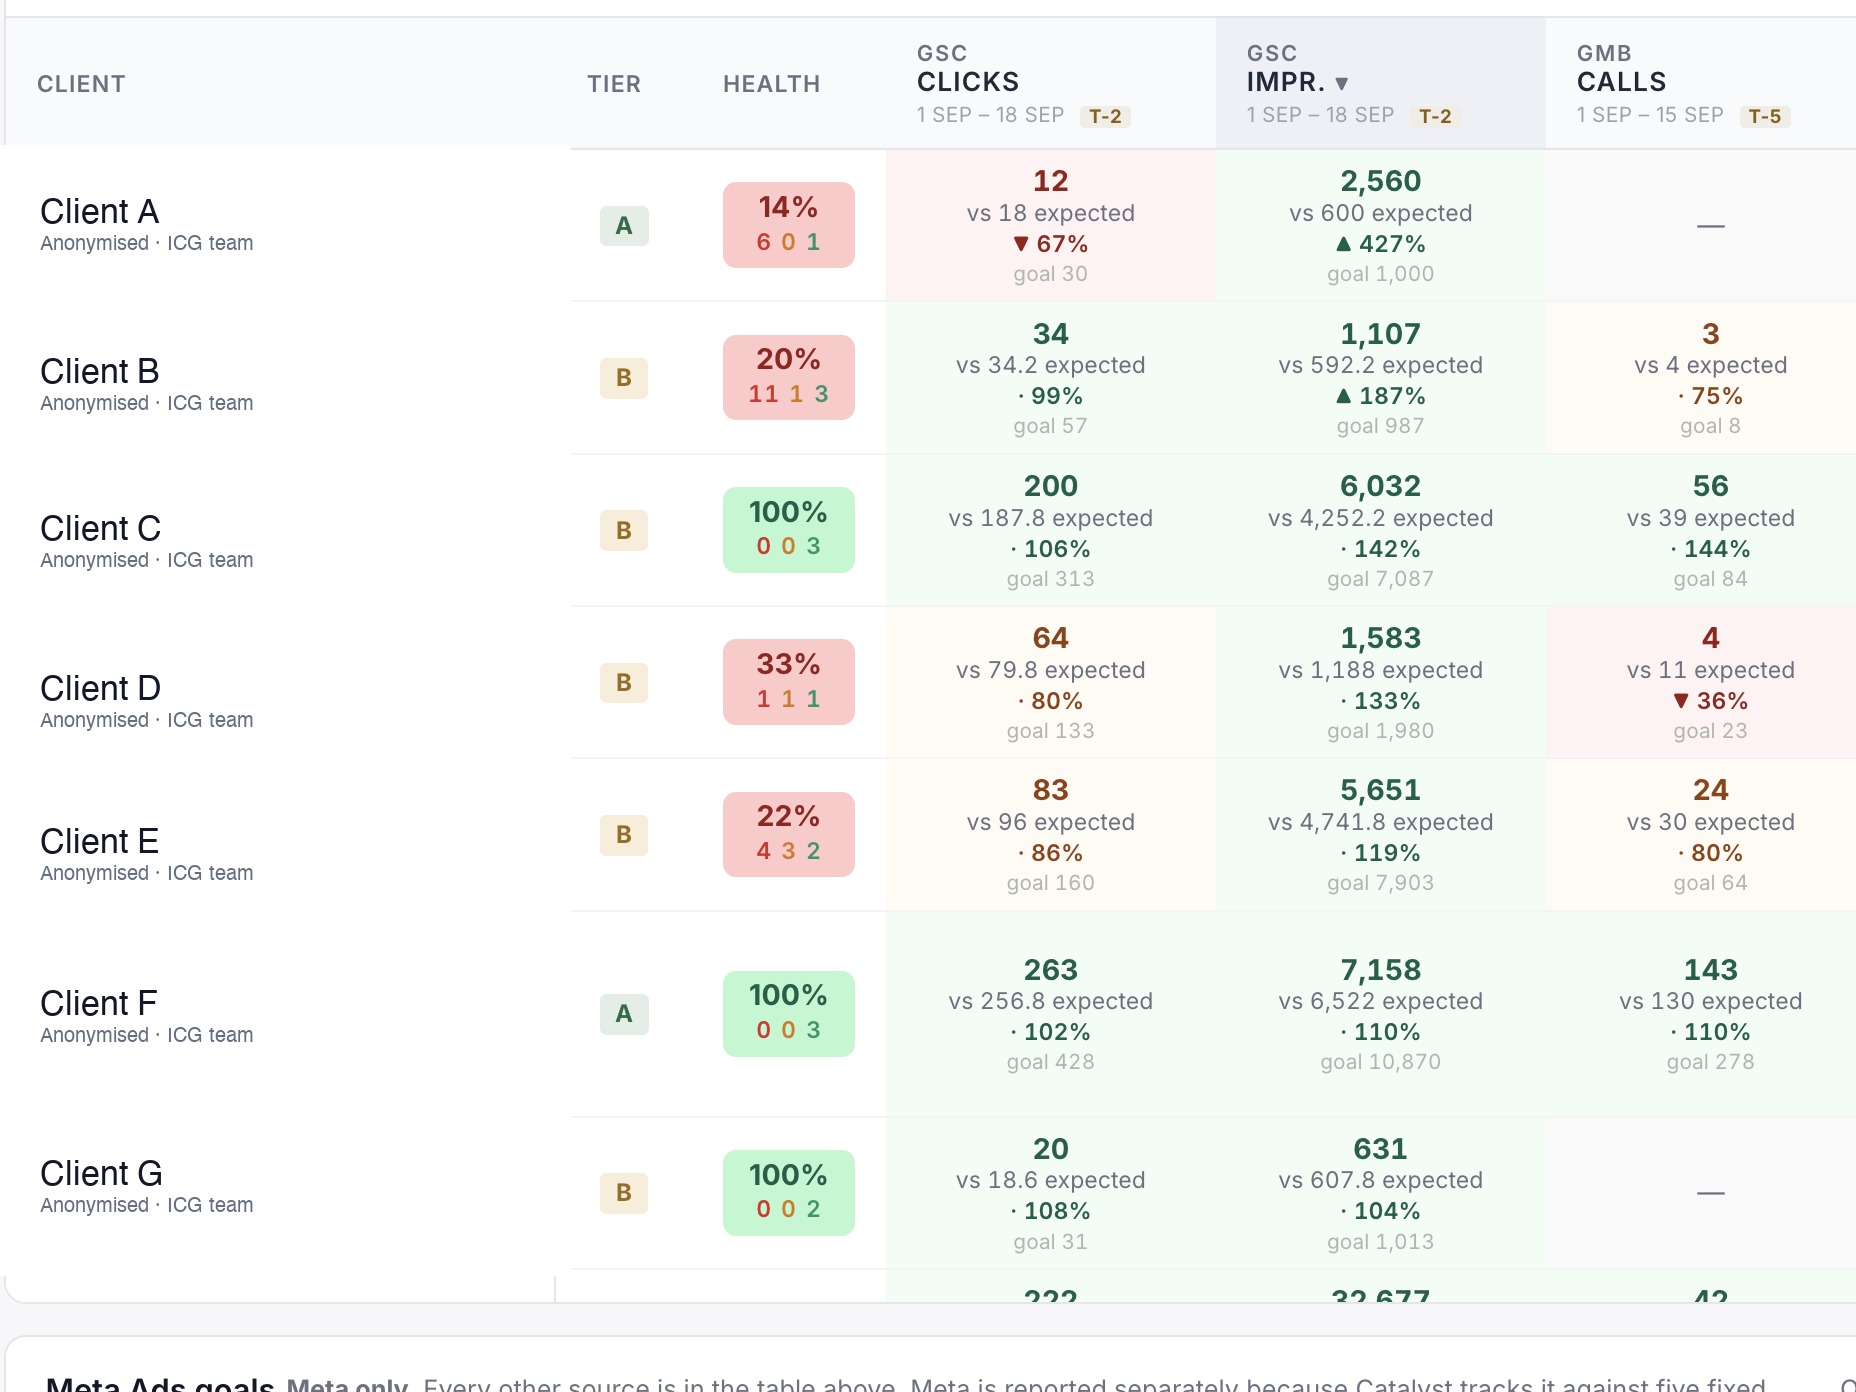
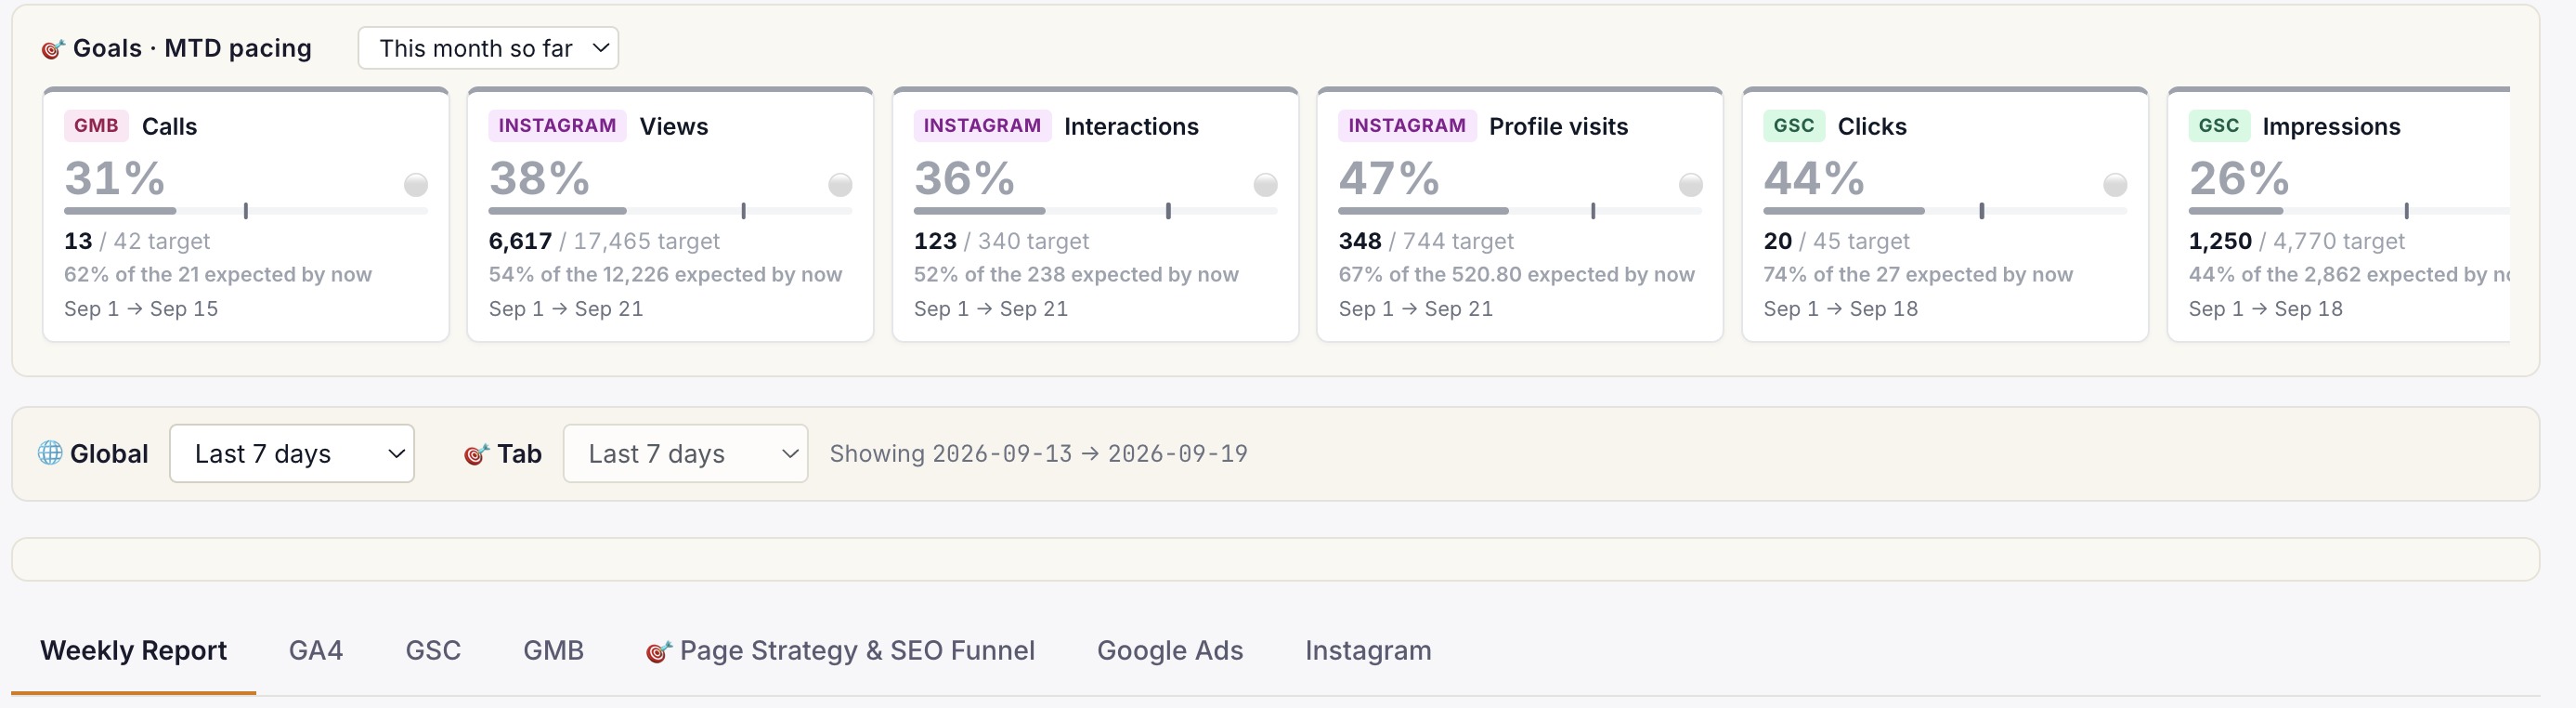
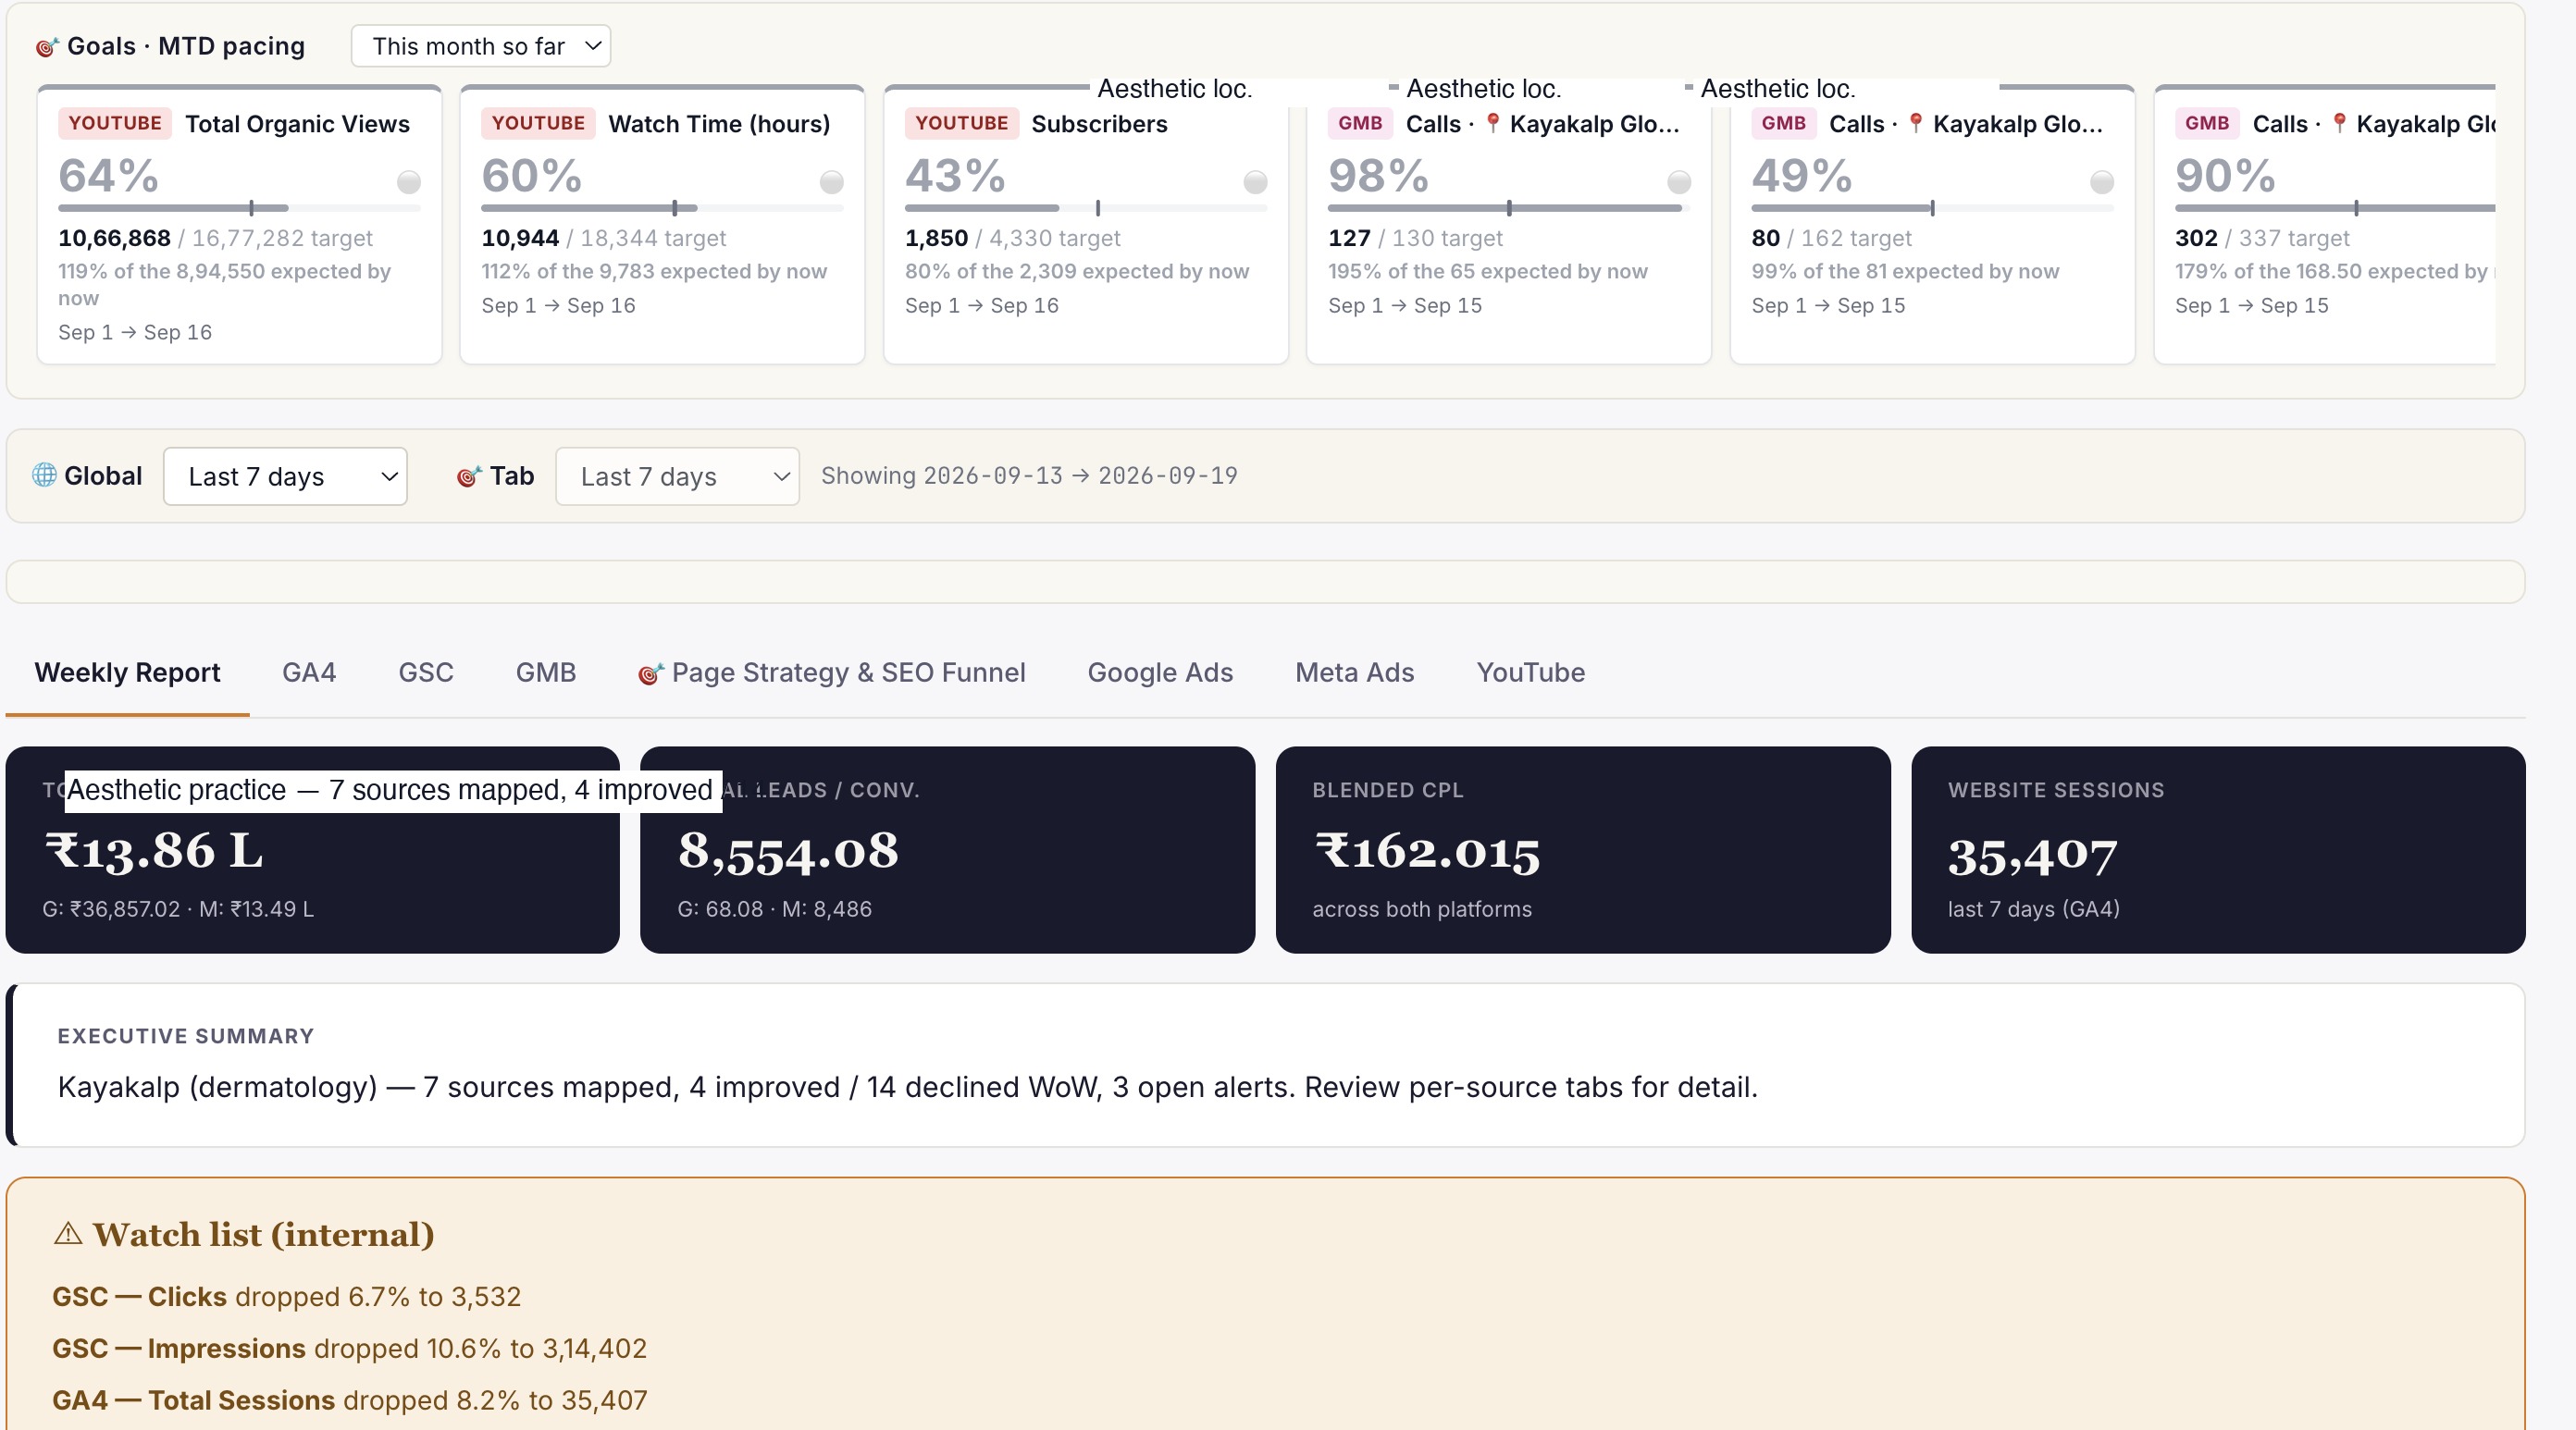
Live client dashboard. GSC, GA4, Google Ads, Meta Ads, IVR calls in one view. Login anytime, not monthly.
Phoenix
Clinic revenue intelligence over your PMS. Daily action queue: Prevent Loss, Maintain & Engage, Grow Revenue. Multi-centre rollout.
Or book a free 30-min audit to see all three in action on your account.
Healthcare brands
that already run on ICG.
A representative slice of the 150+ healthcare brands ICG has delivered for across India. Most engagements remain under NDA.


What ICG clients say · on video.
"Working with ICG transformed how we acquire IVF patients in Gurgaon. They understand the fertility journey from inquiry to consult..."
"ICG built our IVF marketing system from the ground up. The team understands healthcare specifics, not just generic digital marketi..."
Need help operationalising this?
Every ICG service is healthcare-only, NMC + DPDP-aware, and built around the patient-research patterns that drive Indian healthcare growth in 2026.
Every practice welcome — packages from ₹20,000/mo.
Goals-Driven engagements · Performance-Linked Payout Models available
More from
ICG.
Five trends shaping Indian healthcare marketing through 2027: AI-first patient research, Conversions API adoption, ABDM discovery, the AEO w...
Healthcare AIO is the discipline of getting your clinic or hospital cited inside Google AI Overviews, ChatGPT and Perplexity answers — not j...
Conversational-search advertising places brand messages inside AI chat answers — ChatGPT, Perplexity, Copilot — rather than beside a results...
Stop guessing.
Book a Diagnostic.
30 minutes. Free. With the AI-powered healthcare-only marketing agency 150+ brands already run on. No slides, no pitch, no hard close.


