


Competitor share of voice for healthcare Meta ads in India (2026): the four proxies, the honest limits, and how to reallocate budget from what you actually see
How to measure competitor share of voice on Meta ads in Indian healthcare — the four proxies (ad count, active ad days, impression share estimate, spend estimate), what the numbers can and cannot tell you, and how to turn a SOV read into a budget decision.
No pitch. Written root-cause diagnosis. AI-powered, healthcare only.
Direct answer
How to measure competitor share of voice on Meta ads in Indian healthcare — the four proxies (ad count, active ad days, impression share estimate, spend estimate), what the numbers can and cannot tell you, and how to turn a SOV read into a budget decision.
TL;DR
Competitor share of voice on Meta ads is one of the most misunderstood numbers in Indian healthcare marketing. Buyers ask for it, agencies quote it, dashboards render it — and almost nobody is measuring the same thing. In a specialty cluster like IVF, dermatology, dental or aesthetic, the difference between a 12% SOV read and a 34% SOV read comes almost entirely from what proxy you decided to count. This piece walks through the four proxies that actually work on Meta's public ad transparency surface, the ones that don't, how PrismSpy computes SOV across 75+ Indian healthcare brands, and — the part most guides skip — how a marketing lead uses the number to move budget on Monday morning rather than admire it in a slide. If your specialty runs on healthcare Meta ads, this is the read you need before your next quarterly plan.
What share of voice actually means on Meta
Share of voice on Meta ads is, at heart, a claim about how much of the specialty's addressable ad surface is being occupied by a given brand at a given moment. In television and print the calculation was clean because impressions were sold in slots and spend was rate-carded. On Meta the surface is dynamic, auction-based, and personalised — every impression is priced by a real-time auction against a segmented audience. There is no fixed inventory and no published price, so a true impression-share number cannot be computed from outside the platform.
What you can compute from outside is a structured proxy — a number that correlates with impression share within a specialty cluster, is measurable from public data, and moves in the right direction when a competitor increases or decreases activity. That proxy is what every serious Meta SOV tool is actually reporting, whether the interface labels it that way or not. The first job of an honest SOV read is to name the proxy being used.
Why SOV matters more in healthcare than elsewhere
 Meta Catalyst IQ Creative Scoring Matrix ranking every Meta ad creative by hook strength, proof density, offer clarity and CTA — with money-wastage column in rupees" width="1200" height="675" loading="lazy" decoding="async" style="width:100%;height:auto;display:block;">
Consumer categories can absorb blind spending. Healthcare buyers cannot. An IVF clinic paying ₹632 per lead in a cluster where the top three competitors are running 40+ active creatives and doubling weekly spend is losing the auction on impression share even if the CPL looks healthy — the audience will not stay uncontested. A dermatology chain running six ads while three peers run 25 each is not competing; it is renting the shelf temporarily.
The reason SOV matters in Indian healthcare specifically is that the specialty pools are small, the creative half-life is short, and the compliance perimeter (NMC Ethics Code 2026, ASCI Guidelines 2022, ART Act 2021 for fertility, PC-PNDT Act 1994 for prenatal diagnostics) narrows what can be said. Inside a narrowed corpus, the brand with more active creative — running longer, refreshed faster — dominates recall. Missing this shift shows up in booked-consultation counts two months later.
The four proxies that actually work
Four measurable proxies together form a defensible SOV read for Indian healthcare Meta ads. No single one is enough on its own; combining all four is the point.
Proxy 1 — Active ad count. The count of ads a brand has live in the Meta Ad Library on the read date, filtered to India and the specialty ad-set. This is the crudest proxy but the most reliably comparable across brands because both numerator and denominator come from the same source.
Proxy 2 — Active ad days. The sum of live-days across all a brand's active ads. A brand running 20 ads that have each been live for 60 days has 1,200 active ad days; a brand running 40 ads each live 10 days has 400. The first is materially bigger even though the count is half. Longevity is a strong signal of what's converting.
Proxy 3 — Estimated impression share. A modelled number that weights active ads by placement mix, format (Reels vs static), audience-broad vs audience-narrow signals, and creative freshness. This is where tools diverge — everyone estimates, few disclose the model.
Proxy 4 — Estimated spend share. The cross-brand share of estimated ad spend within the specialty cluster. Estimated because Meta does not publish spend for non-political ads; derived from active-ad-day counts, placement modelling and specialty CPM benchmarks.
Ad count share: the honest floor
Start with active ad count share because it is the most auditable number in the stack. Pull every brand in the specialty cluster, count active ads per brand, sum the total, express each brand as a percentage of the total. In a typical Delhi-NCR IVF cluster PrismSpy tracks, the top brand might hold 22-28% of active ad count, the next two combine for 30-35%, the mid-tier five combine for 25-30%, and the long tail of 20+ brands share the remaining 12-18%.
The number is honest in what it says: this brand has this many live creatives in market. It is silent on how many people are seeing them. Two brands with identical ad counts can have wildly different impression footprints because Meta's auction rewards relevance, budget signals and creative fatigue asymmetrically. Ad count share is therefore the floor, not the answer — but a brand that has fallen from 22% to 8% of ad count in a quarter is unambiguously ceding shelf.
Active ad days: the longevity signal that separates test from proven creative
Active ad days is the proxy that distinguishes a brand testing 40 short-lived creatives from one running 40 proven long-tail ads. On Meta, a healthcare ad that has been live for 60-plus days without being paused is almost certainly performing — the account team would have killed it otherwise. Longevity is therefore a proxy for cost-efficient conversion inside the account.
When a brand's active ad days rise faster than its ad count, that brand has found creative that converts and is holding it up longer. When active ad days fall while ad count holds, the brand is churning creative — usually a sign the previous winners fatigued or a competitor forced a refresh. Reading active ad days across a specialty cluster over a rolling eight-week window is one of the most useful competitive-intelligence exercises a healthcare marketing lead can do. PrismSpy renders this as a heat map inside the Comparative Insights view.

Estimated impression share: what modelling actually does, and where it stops
Estimated impression share tries to answer: of the specialty's total Meta ad impressions this month, roughly what share went to each brand? Because Meta does not report cross-account impression counts, every published number is a model. Serious models weight active ads by placement mix (Reels get more impressions per creative than static feed), by format signals (video vs image), by audience-broadness inference (a creative rotating across 30 lookalike variants throws a wider net than a highly-targeted retargeting piece) and by creative freshness (new creatives get an algorithmic honeymoon).
Even a good model will be wrong in absolute terms. Where it earns its keep is in relative movement — a brand whose modelled impression share moves from 14% to 22% over eight weeks in a fixed cluster is materially expanding, and a competitor whose share moves from 25% to 14% is materially retreating. The direction and magnitude are the signal; the exact percentage is not. Treat every published impression share number as a directional read, not a point estimate.
Estimated spend share and its limits
Spend share is the number CFOs want and the number nobody can measure exactly. Meta does not disclose spend for commercial ads — only political ads carry spend ranges. Every commercial spend number in every tool is inferred, usually as a function of active-ad-day counts, placement modelling, format assumptions and specialty CPM benchmarks that ICG has built up from managing Meta Catalyst IQ — 23+ Indian healthcare accounts, ₹9.1Cr+ optimised spend per month, ₹1,581 blended CPL vs ~₹3,200 market benchmark.
The right way to use estimated spend share is as a coarse tier bucket, not a rupee figure. A brand estimated at ₹40-60L per month on Meta is meaningfully bigger than one estimated at ₹8-12L. Whether the first brand is spending ₹47L or ₹53L is not knowable from outside. Treat the tier bucket as directionally reliable and the exact number as an artefact of the model.
How PrismSpy computes SOV across 75+ tracked brands
PrismSpy pulls all four proxies daily across the 75+ Indian healthcare brands under active tracking, clusters them by specialty (IVF, dermatology, dental, hair transplant, aesthetic, hospital, paediatric, mental health, ENT, ophthalmology, orthopaedic, cardiology, oncology, wellness) and renders both point-in-time SOV and eight-week SOV trend. Ad count share and active ad days are direct measurements. Impression share and spend share are modelled from the direct measurements plus PrismSpy's specialty CPM library, which is calibrated quarterly against the live spend telemetry from Meta Catalyst IQ portfolios (only for calibration; no client-account data leaves the account boundary — DPDP-safe).
The output an operator sees is the brand's SOV percentile within the specialty cluster, the eight-week movement, the top three brands gaining SOV, the top three losing SOV, and a per-format breakdown (Reels, static feed, carousel, video feed). Every number is labelled with the proxy source so a marketing lead defending the read to a board can point at the underlying method. The 4,697 searchable ad inspirations and 1,197 offers in the PrismSpy database also cluster into the SOV view so the operator sees which formats and hooks are actually earning the impressions being counted.


Turning SOV into a budget reallocation decision
SOV is only worth measuring if it moves budget. Here is the working framework Meta Catalyst IQ account leads run inside the ICG portfolio. When a client brand's SOV in its specialty is materially below its target consultation share (say 8% SOV against a 15% target booking share) and CPL is at or below benchmark, the read is unambiguous: increase budget, the auction has room, the funnel converts. When SOV is above target share but CPL is climbing, the read is fatigue — refresh creative before adding spend. When SOV is below target and CPL is above benchmark, the read is a creative problem, not a budget problem — no amount of extra spend will fix a creative that isn't landing.
The wrong decision is the reflex one: seeing a competitor's SOV climb and matching spend without diagnosing whether the auction actually has room or whether the competitor found a hook worth copying (the honest word is inspiration — see the 4,697-item PrismSpy inspirations library). Reallocation should follow the two-by-two of SOV movement and CPL movement, not the panic response to a competitor's dashboard.
Compliance considerations when reading competitor SOV
An Indian healthcare SOV read has to observe two guardrails that don't apply in other verticals. First, the creatives being counted are subject to the NMC Ethics Code 2026 and ASCI Guidelines 2022 — a competitor running an ad that violates outcome-guarantee restrictions or comparative-superiority claims is not a signal to copy, it is a signal to flag. PrismSpy's Comparative Insights view labels ads that appear to breach the perimeter so operators do not accidentally treat non-compliant creative as a benchmark.
Second, IVF and fertility work sits under the ART Act 2021, which restricts success-rate claims and specific comparative language. Prenatal diagnostic work sits under PC-PNDT 1994. SOV reads inside these specialties therefore need to weight only compliant creative when computing the leader board — otherwise the operator ends up chasing a competitor that is heading for an ASCI reprimand. This filter is on by default inside PrismSpy's IVF and prenatal cluster views.
Powered by PrismSpy — every competitor Meta ad, watched daily
ICG built PrismSpy because Indian healthcare Meta ad competition is invisible without it. 75+ Indian healthcare brands tracked, 2,150+ active ads catalogued, ₹50Cr+ aggregate ad spend visibility per month. Every competitor ad — creative, offer, hook, run-length — refreshed daily. It runs underneath every Meta ads and performance marketing engagement at ICG.
- Watchlist Dashboard — 30-75 competitors per specialty cluster (IVF / dermatology / dental / hair transplant / aesthetic / hospital), daily refresh.
- Comparative Insights — highest-quality ads, longest-running creatives (proven converters), top hooks, emerging offers.
- Offers Intelligence — 1,197 offers tracked, discount intensity by brand, value tier distribution.
- Service Cluster + Inspirations — 419 services tracked, 4,697 searchable ad inspirations by hook / language / format.
Standalone from ₹4,999/- per specialty vertical, or bundled free inside HealthApex OS (₹14,999/- flat, 9 tools). Book a 30-min PrismSpy walkthrough on WhatsApp — Rohit + Hanuman walk you through your specialty's competitive landscape.
 angryturtle/01-listing-overview.png" alt="Angryturtle Listing Overview — GBP watchlist with per-listing status, category, sub-scores, action count for 143+ managed Indian healthcare listings" loading="lazy" decoding="async" style="width:100%;height:auto;display:block;">

Related reading
- Healthcare Meta ads agency India — the pillar guide
- IVF marketing agency India — CPL benchmarks and creative playbook
- Dermatology marketing agency India
- Meta Catalyst IQ — the account-side platform running the CPL work
- Healthcare performance marketing service
- Request a free healthcare Meta ads audit
FAQ
Q. Can Meta share of voice ever be measured exactly?
No. Meta does not publish cross-account impression or spend data for commercial ads. Every SOV number outside the platform is a proxy or a model. The most defensible reads combine four proxies — ad count share, active ad days, modelled impression share and modelled spend share — and treat directional movement as the signal, not absolute percentages.
Q. Which SOV proxy is most useful day to day?
Active ad days. It captures both breadth (how many creatives are live) and durability (how long each has survived Meta's auction), and durability is the strongest external proxy for account-level performance. A rising active-ad-day count on a competitor is a stronger signal than a rising raw count.
Q. How does PrismSpy handle brands that boost organic posts instead of running structured ad sets?
Boosted posts appear in Meta Ad Library once they cross the platform's boosted-content threshold, so PrismSpy catches them in the daily refresh. The scoring model tags them separately so operators can distinguish structured campaign spend from tactical post-boosting when reading SOV.
Q. Do PrismSpy's SOV reads work for Google ads as well?
Yes — PrismSpy pulls both Meta Ad Library and the Google Ads Transparency Centre, and computes SOV proxies for each. Google's transparency layer is thinner than Meta's in India, so the Google SOV read is coarser and leans harder on active-ad-count share. The Meta read is the primary decision layer for most specialty clusters.
Q. What SOV movement should trigger a budget review?
A cluster-relative shift of eight percentage points or more over a rolling eight-week window in either direction is the trigger threshold used inside Meta Catalyst IQ account reviews. Smaller shifts are within model noise; larger shifts warrant a diagnostic before reallocation.
Q. Is competitor SOV research legal under DPDP Act 2023?
Yes when the data comes from public sources — Meta Ad Library and Google Ads Transparency Centre are both public disclosures required by regulators globally. PrismSpy uses only these public surfaces plus public landing-page reads; it does not touch competitor CRM, private dashboards or DPDP-protected personal data.
Q. Does share of voice predict share of consultations booked?
Directionally yes, over a two-to-three-month window and inside the same specialty and geography. It is not a mechanical one-to-one. SOV is one input into the booking-share equation alongside offer strength, brand trust, referral share and organic visibility. Reading SOV against booking share is how account leads catch imbalances early.
Q. How often does PrismSpy refresh the SOV read?
Daily. The Meta and Google transparency pulls run every 24 hours across the tracked cluster; the SOV computation runs on the fresh dataset. Comparative Insights update in near real time for the operator.
For the regulatory context, see the Advertising Standards Council of India (ASCI) guidelines and Meta's own Ad Library transparency surface.
Book a free Meta ads account audit.
Raman Soni's team pulls your account, checks CAPI/EMQ, reviews creative for NMC compliance, and shows where CPQL is leaking. 45 minutes, actionable output.
The three platforms
behind every ICG engagement.
Beacon
CAPI middleware that fixes Event Match Quality, translates CRM statuses to Meta-standard events, dedups across channels.
Agency OS
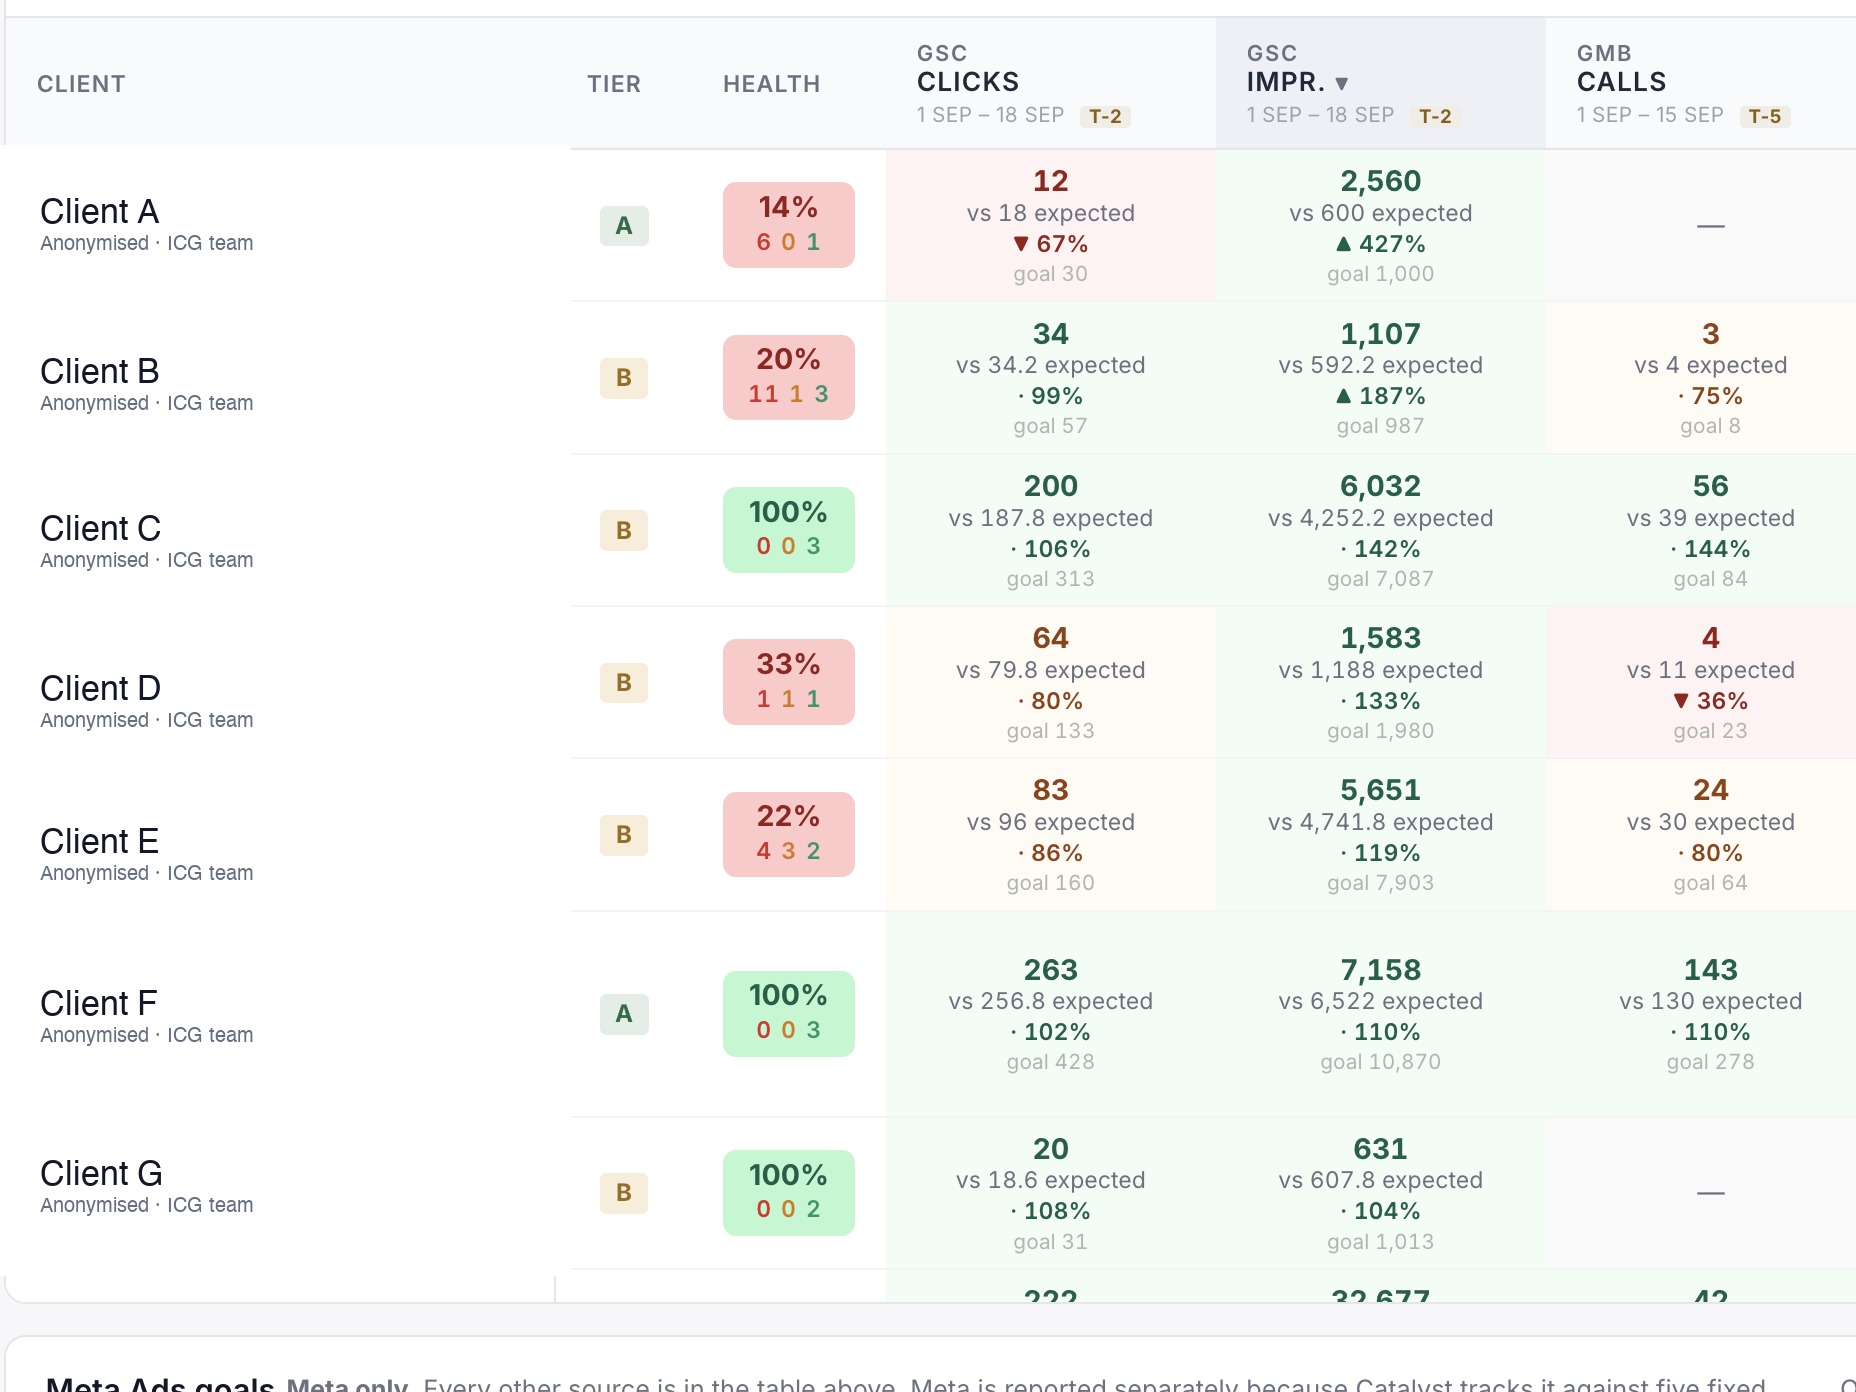
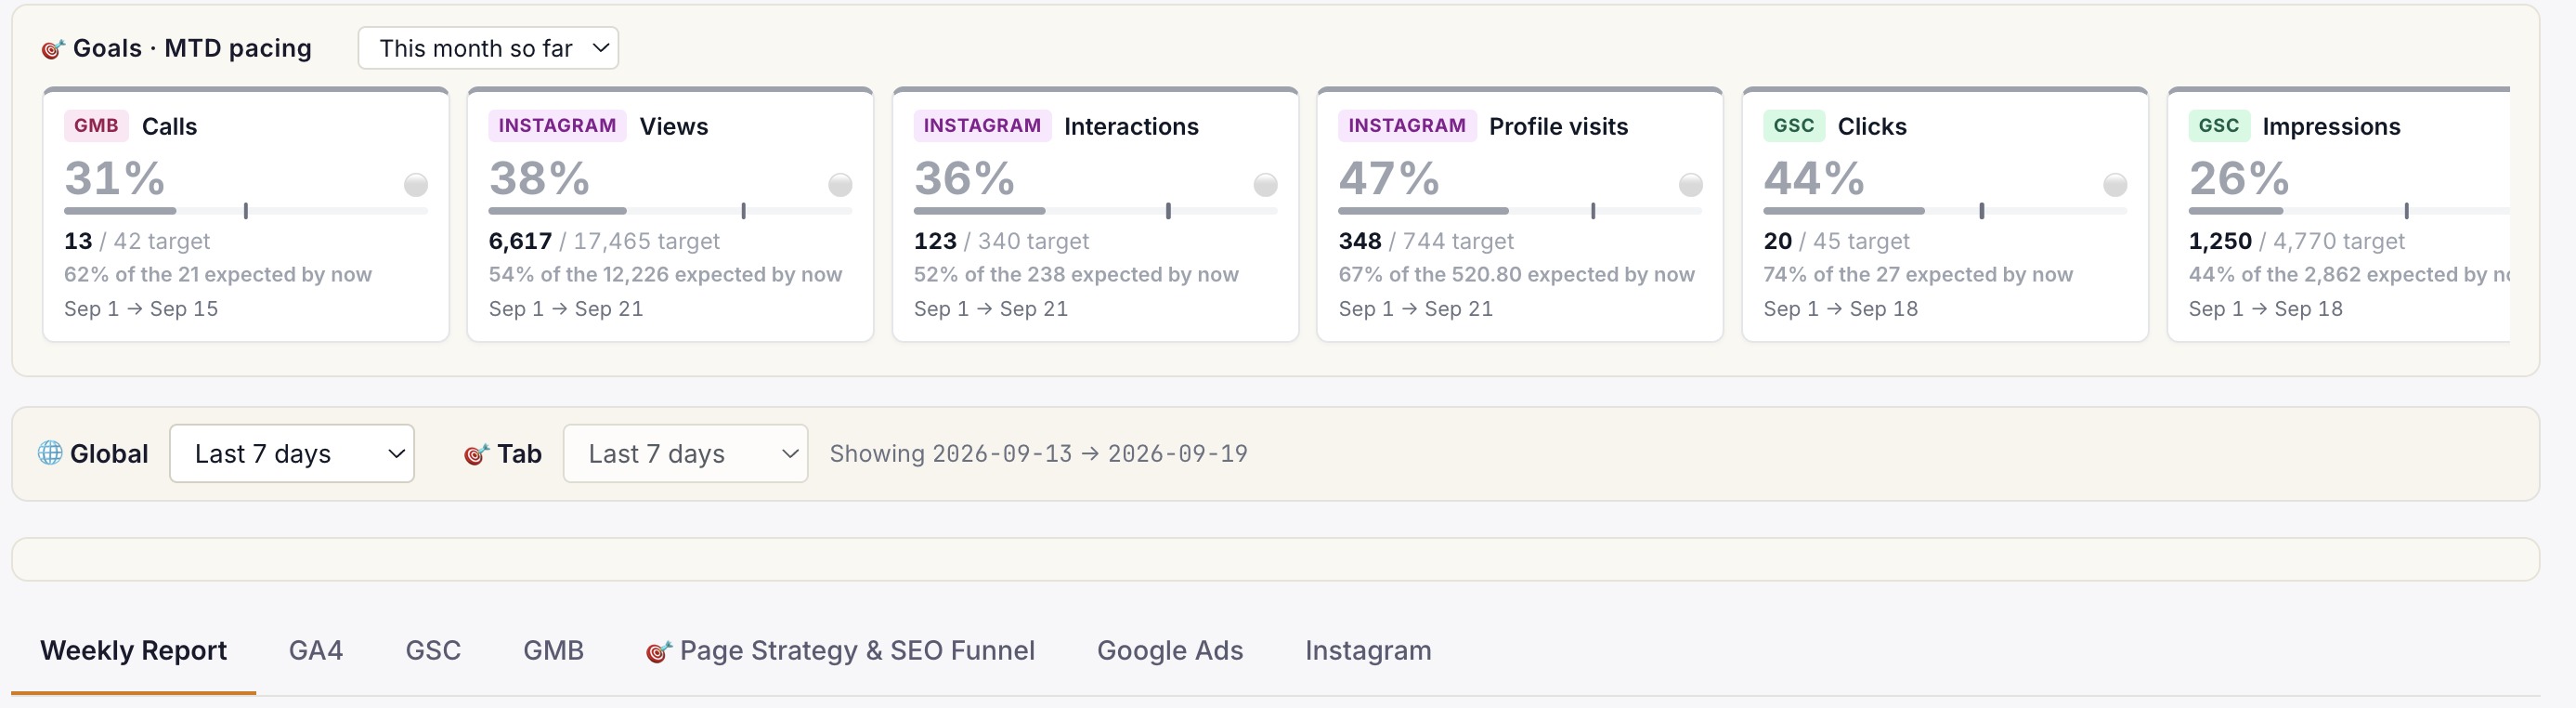
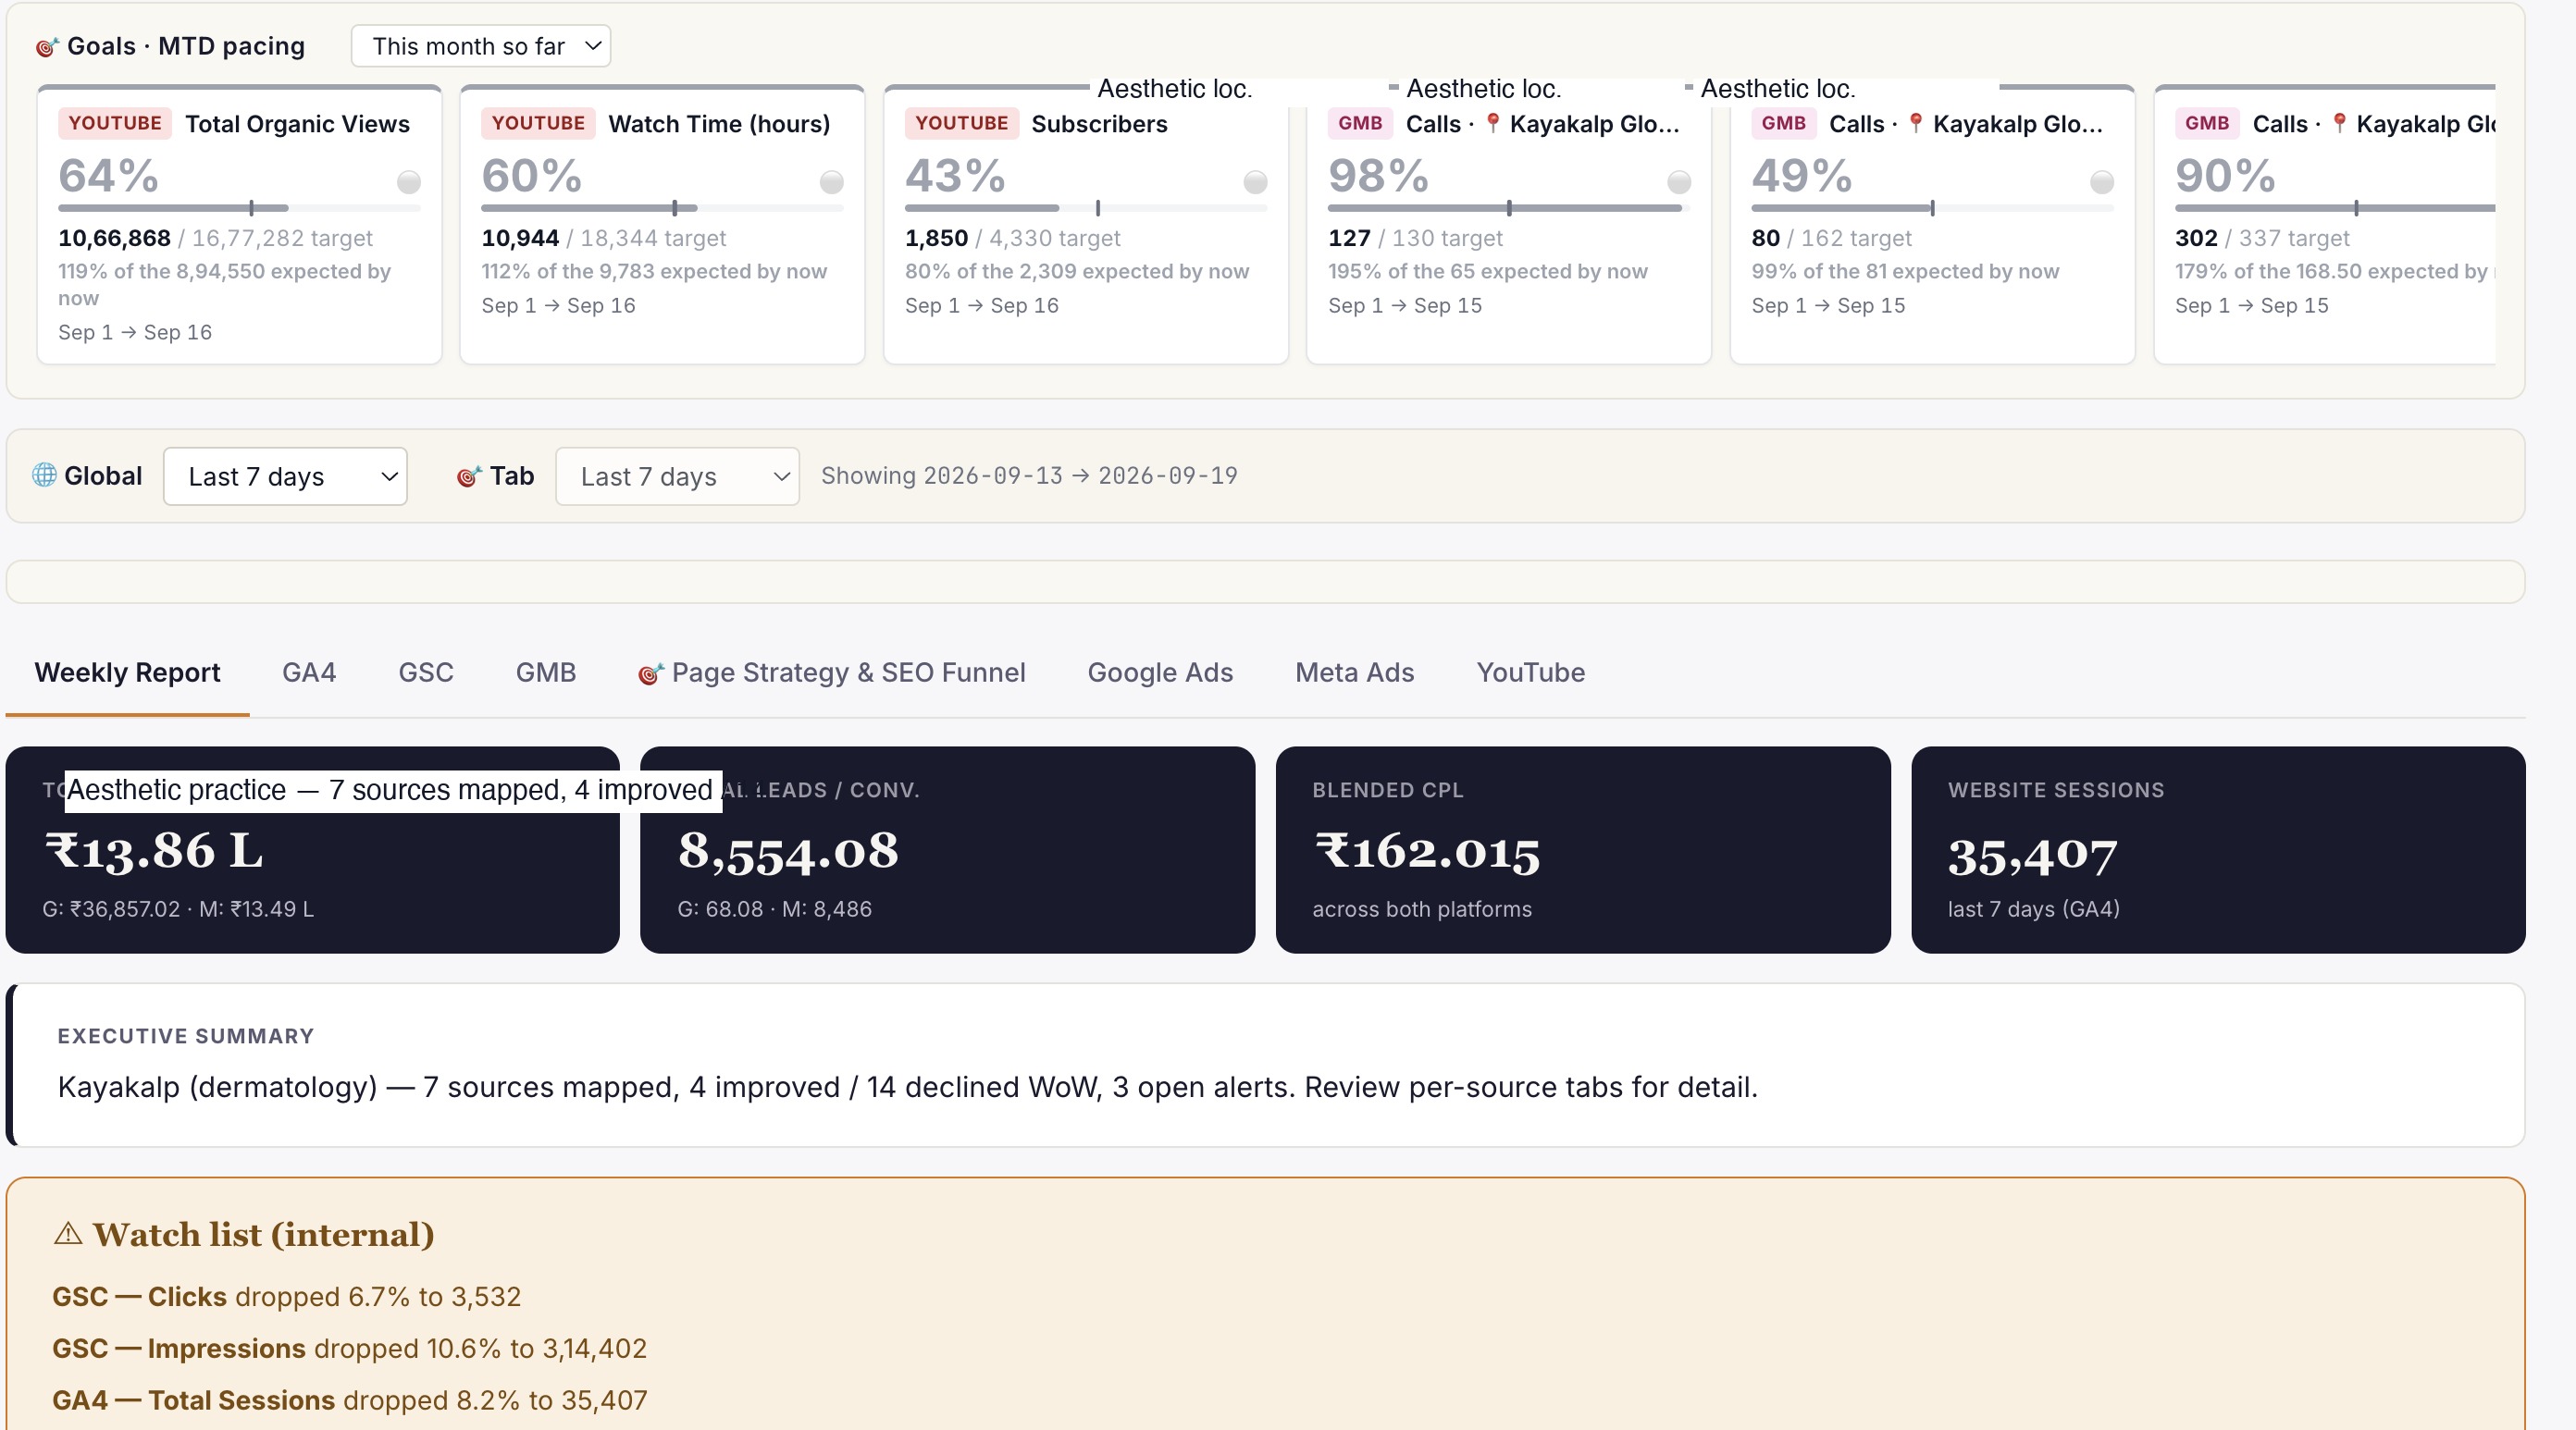
Live client dashboard. GSC, GA4, Google Ads, Meta Ads, IVR calls in one view. Login anytime, not monthly.
Phoenix
Clinic revenue intelligence over your PMS. Daily action queue: Prevent Loss, Maintain & Engage, Grow Revenue. Multi-centre rollout.
Or book a free 30-min audit to see all three in action on your account.
Healthcare brands
that already run on ICG.
A representative slice of the 150+ healthcare brands ICG has delivered for across India. Most engagements remain under NDA.


What ICG clients say · on video.
"Scale up of organic channels and business consulting. ICG has absolute domain authority in their field."
"Working with ICG transformed how we acquire IVF patients in Gurgaon. They understand the fertility journey from inquiry to consult..."
"What Ichelon accomplished — they got all my ideas and worked over 3-4 months to create an amazing, super-customised website."
The intelligence stack behind this playbook.
Every ICG engagement runs on the Search Intelligence Trifecta — Angryturtle for GMB, SIE for search and AI Overview, YODA for YouTube. Live product screens below.
Need help operationalising this?
Every ICG service is healthcare-only, NMC + DPDP-aware, and built around the patient-research patterns that drive Indian healthcare growth in 2026.
Every practice welcome — packages from ₹20,000/mo.
Goals-Driven engagements · Performance-Linked Payout Models available
More from
ICG.
Five trends shaping Indian healthcare marketing through 2027: AI-first patient research, Conversions API adoption, ABDM discovery, the AEO w...
Healthcare AIO is the discipline of getting your clinic or hospital cited inside Google AI Overviews, ChatGPT and Perplexity answers — not j...
Conversational-search advertising places brand messages inside AI chat answers — ChatGPT, Perplexity, Copilot — rather than beside a results...
Stop guessing.
Book a Diagnostic.
30 minutes. Free. With the AI-powered healthcare-only marketing agency 150+ brands already run on. No slides, no pitch, no hard close.


