


YouTube Analytics for Medical Channels: What Actually Matters in India
Most hospital marketers read YouTube analytics like a monetised creator. That is why the dashboard looks green while patient enquiries stay flat. Here is the healthcare-specific reading that actually tracks revenue.
No pitch. Written root-cause diagnosis. AI-powered, healthcare only.
Direct answer
Most hospital marketers read YouTube analytics like a monetised creator. That is why the dashboard looks green while patient enquiries stay flat. Here is the healthcare-specific reading that actually tracks revenue.
TL;DR
YouTube analytics for medical channels in India need a healthcare-specific reading. Watch time, retention at the 30-second mark, unique-viewer-to-subscriber ratio by playlist, and the traffic-source split between YouTube Search and Suggested tell you whether your channel is compounding trust or leaking it. Vanity views and short-form virality lie to hospital marketers more than any other dashboard on the internet.
TL;DR
- The four YouTube analytics metrics that actually move healthcare revenue are watch time per session, retention at the 30-second mark, unique viewers-to-subscribers ratio by playlist, and traffic-source share from YouTube Search.
- Indian medical channels see 3 to 5 times higher retention on Hindi and vernacular content compared to English for the same specialty. Dashboards that group all languages together hide this.
- YouTube Studio rarely tells you which videos were cited by Google AI Overviews, Gemini, or Perplexity. You have to layer Search Console, brand-search lift, and direct-traffic spikes to reverse-engineer AIO pickup.
- ICG uses a healthcare-only YouTube analytics stack via YODA that treats every video as a lead-source unit, not a content unit. The reporting logic changes when the goal is patient enquiries, not watch hours.
Table of contents
- Why do YouTube analytics for medical channels need a different playbook?
- Which YouTube analytics metrics actually matter?
- How do you read audience retention on a medical video?
- What does CTR mean when the thumbnail shows a doctor's face?
- How should medical channels use the traffic sources report?
- Which YouTube analytics signals predict AIO citations?
- What benchmarks should Indian medical channels aim for?
- How does ICG measure YouTube for healthcare clients?
- Frequently asked questions
Why do YouTube analytics for medical channels need a different playbook in India?
Because a medical channel's job is not to entertain, it is to convert search intent, hospital-brand curiosity, and second-opinion behaviour into consultations. Generic YouTube dashboards optimise for watch time and CTR because that is what monetised creator channels care about. A cardiology department at a 400-bed hospital in Pune has none of those goals.
India crossed 550 million YouTube users by late 2025, and healthcare is one of the top five information-seeking categories after entertainment, education, news, and finance. The behaviour on a medical video is different from any other category. Viewers rarely binge. They land from a specific query, watch until their doubt is resolved, then either book or leave. A 4-minute average view duration on a general vlog is average. On a "cost of angioplasty in Delhi" video, it is a warning sign that the doctor took too long to answer.
Indian regulatory context complicates it further. Under the National Medical Commission (NMC) guidelines and the Drugs and Magic Remedies Act, doctors cannot make outcome guarantees, use before-and-after imagery irresponsibly, or promise cures. That means your analytics should reward educational depth, not conversion-farm scripts. And the DPDP Act now restricts how you can retarget viewers who watched a fertility, oncology, or mental-health video, so channel-level segmentation matters more than it used to.
Which YouTube analytics metrics actually matter for a medical channel?
Four metrics do the heavy lifting: watch time per session, audience retention at the 30-second mark, unique viewers-to-subscribers ratio per playlist, and the share of traffic coming from YouTube Search versus Suggested. Everything else is either a leading indicator or a distraction.
Here is what each one actually tells a hospital marketer or agency lead.
| Metric | What it really measures | Healthy range for Indian medical channels |
|---|---|---|
| Watch time per session | Whether a viewer trusts the channel enough to watch a second video | 1.6 to 2.4 videos per session |
| Retention at 30 seconds | Whether the doctor answered the query in the intro or padded it | Above 68 percent |
| Unique viewers-to-subscribers ratio | Whether the channel is reaching new patients or just re-serving old ones | Between 4:1 and 8:1 monthly |
| YouTube Search traffic share | Whether the channel is being found for real intent, not lucky algorithmic pushes | 35 to 55 percent |
| External traffic from Google Search | Whether videos are ranking in blended SERPs and AI Overviews | 8 to 18 percent |
Notice that subscribers is not on the list. A doctor's channel with 12,000 subscribers and consistent 4,000 views per new video will out-earn a channel with 90,000 subscribers and 900 views per new video. Subscribers only matter as a denominator for the ratio above. Treat them as a signal, not a scoreboard.
How do you read audience retention on a medical video?
Read it in three zones: the first 30 seconds, the 40 to 60 percent mid-drop, and the last 15 percent. Each zone reveals a different failure. A retention curve that looks fine end-to-end can still be hiding two of them.
The first 30 seconds are the query-match test. If the viewer searched "root canal cost in Bangalore" and the doctor spends 40 seconds introducing the hospital and their credentials, retention will crash from 100 percent to under 55 percent before the actual answer appears. On Indian medical content we consistently see the strongest channels answer the search query inside the first 12 to 18 seconds, then earn the credentials segment later.
The 40 to 60 percent mid-drop is where explainer videos lose people who got what they came for. This is not a failure. If your goal is enquiries, a viewer who leaves at 55 percent after understanding the procedure and seeing the CTA card is a win. Track calls to the WhatsApp number and form fills against this cohort, not against 90-percent-plus retainers.
The last 15 percent is the trust zone. Viewers who stay to the end are your highest-intent segment. In our YODA reporting on IVF and dental channels across Delhi NCR, Bangalore, and Hyderabad, viewers who cross the 85 percent mark are 6 to 9 times more likely to convert to a consultation booking within 14 days than average viewers. If your end-screen or WhatsApp CTA is weak, you are wasting the most valuable segment your channel produces.
What does CTR mean when the thumbnail shows a doctor's face?
Click-through rate on medical thumbnails behaves nothing like CTR on entertainment content. A 4 percent CTR on a doctor-led dermatology video with a plain thumbnail can outperform a 12 percent CTR on a clickbait thumbnail because the intent quality is completely different. Never optimise CTR in isolation on a medical channel.
Three CTR patterns are worth watching in YouTube Studio.
- Impressions CTR by traffic source. A 3 percent CTR from YouTube Search is healthier than a 9 percent CTR from Suggested Videos on a medical channel, because search CTR is a proxy for intent match. Filter the CTR report by source before drawing any conclusion.
- CTR by device. Mobile CTR in India is typically 2 to 3 percentage points lower than desktop for healthcare content because viewers scroll faster and the thumbnail preview is smaller. Judge mobile thumbnails on a separate scale.
- CTR versus average view duration correlation. If CTR is rising but AVD is dropping, the thumbnail is over-promising. This is the single biggest reason medical channels get algorithmically demoted after an initial spike. YouTube penalises misleading thumbnails on health topics more aggressively than on general content.
The rule for Indian medical channels: never chase a CTR above 10 percent on a doctor-led explainer. The clicks you attract past that point are curiosity clicks, not intent clicks, and they poison the retention data that the algorithm actually uses to decide what to promote next.
How should medical channels use the YouTube traffic sources report?
The traffic sources report is the closest thing YouTube Studio gives you to a demand map. Read it as a diagnostic of where your patient discovery pipeline is strong and where it is dependent on algorithmic charity.
A healthy Indian medical channel usually shows this distribution once it crosses a few thousand subscribers and 60-plus videos.
- YouTube Search: 35 to 55 percent. This is the demand you own.
- Suggested videos: 20 to 30 percent. This is algorithmic reach off other creators.
- External sources (Google Search, embeds, WhatsApp shares): 10 to 20 percent. This includes AI Overviews and Gemini citations.
- Browse features (homepage, subscription feed): 8 to 15 percent. This is loyalty.
- Playlists and end screens: 5 to 12 percent. This is session engineering.
Two red flags to spot: Suggested traffic over 55 percent means the channel is riding an algorithm push and will crash the moment YouTube stops promoting the topic. External traffic under 5 percent means the channel is invisible to Google Search and by extension to AI Overviews, which is a slow-motion disaster for a healthcare brand in 2026.
Which YouTube analytics signals predict AIO and Gemini citations from your videos?
Four signals correlate strongly with a video getting picked up as a citation inside Google AI Overviews, Gemini answers, or Perplexity summaries: high external-source traffic from Google Search, above-average retention on the first two minutes, transcript quality with clean chapter markers, and repeat inbound linking from your own website blog to the video page.
YouTube Studio does not tell you directly that Gemini quoted your video. You have to reverse-engineer it. Layer three data streams: the "external" traffic row in YouTube analytics, a Search Console impression spike on branded doctor-name queries in the same 48-hour window, and a direct-traffic bump to the corresponding blog page on your site. When all three move together after a new video goes live, an AIO citation is the most likely explanation.
Transcript hygiene matters more than most Indian channels realise. YouTube auto-generated captions for Hindi, Tamil, Telugu, Bengali, and Marathi are usable but still miss 15 to 25 percent of medical terminology. Uploading a manually-reviewed transcript per video is one of the highest-ROI analytics improvements you can make, because it directly feeds the surface that AI answer engines scrape.
What YouTube analytics benchmarks should Indian medical channels aim for?
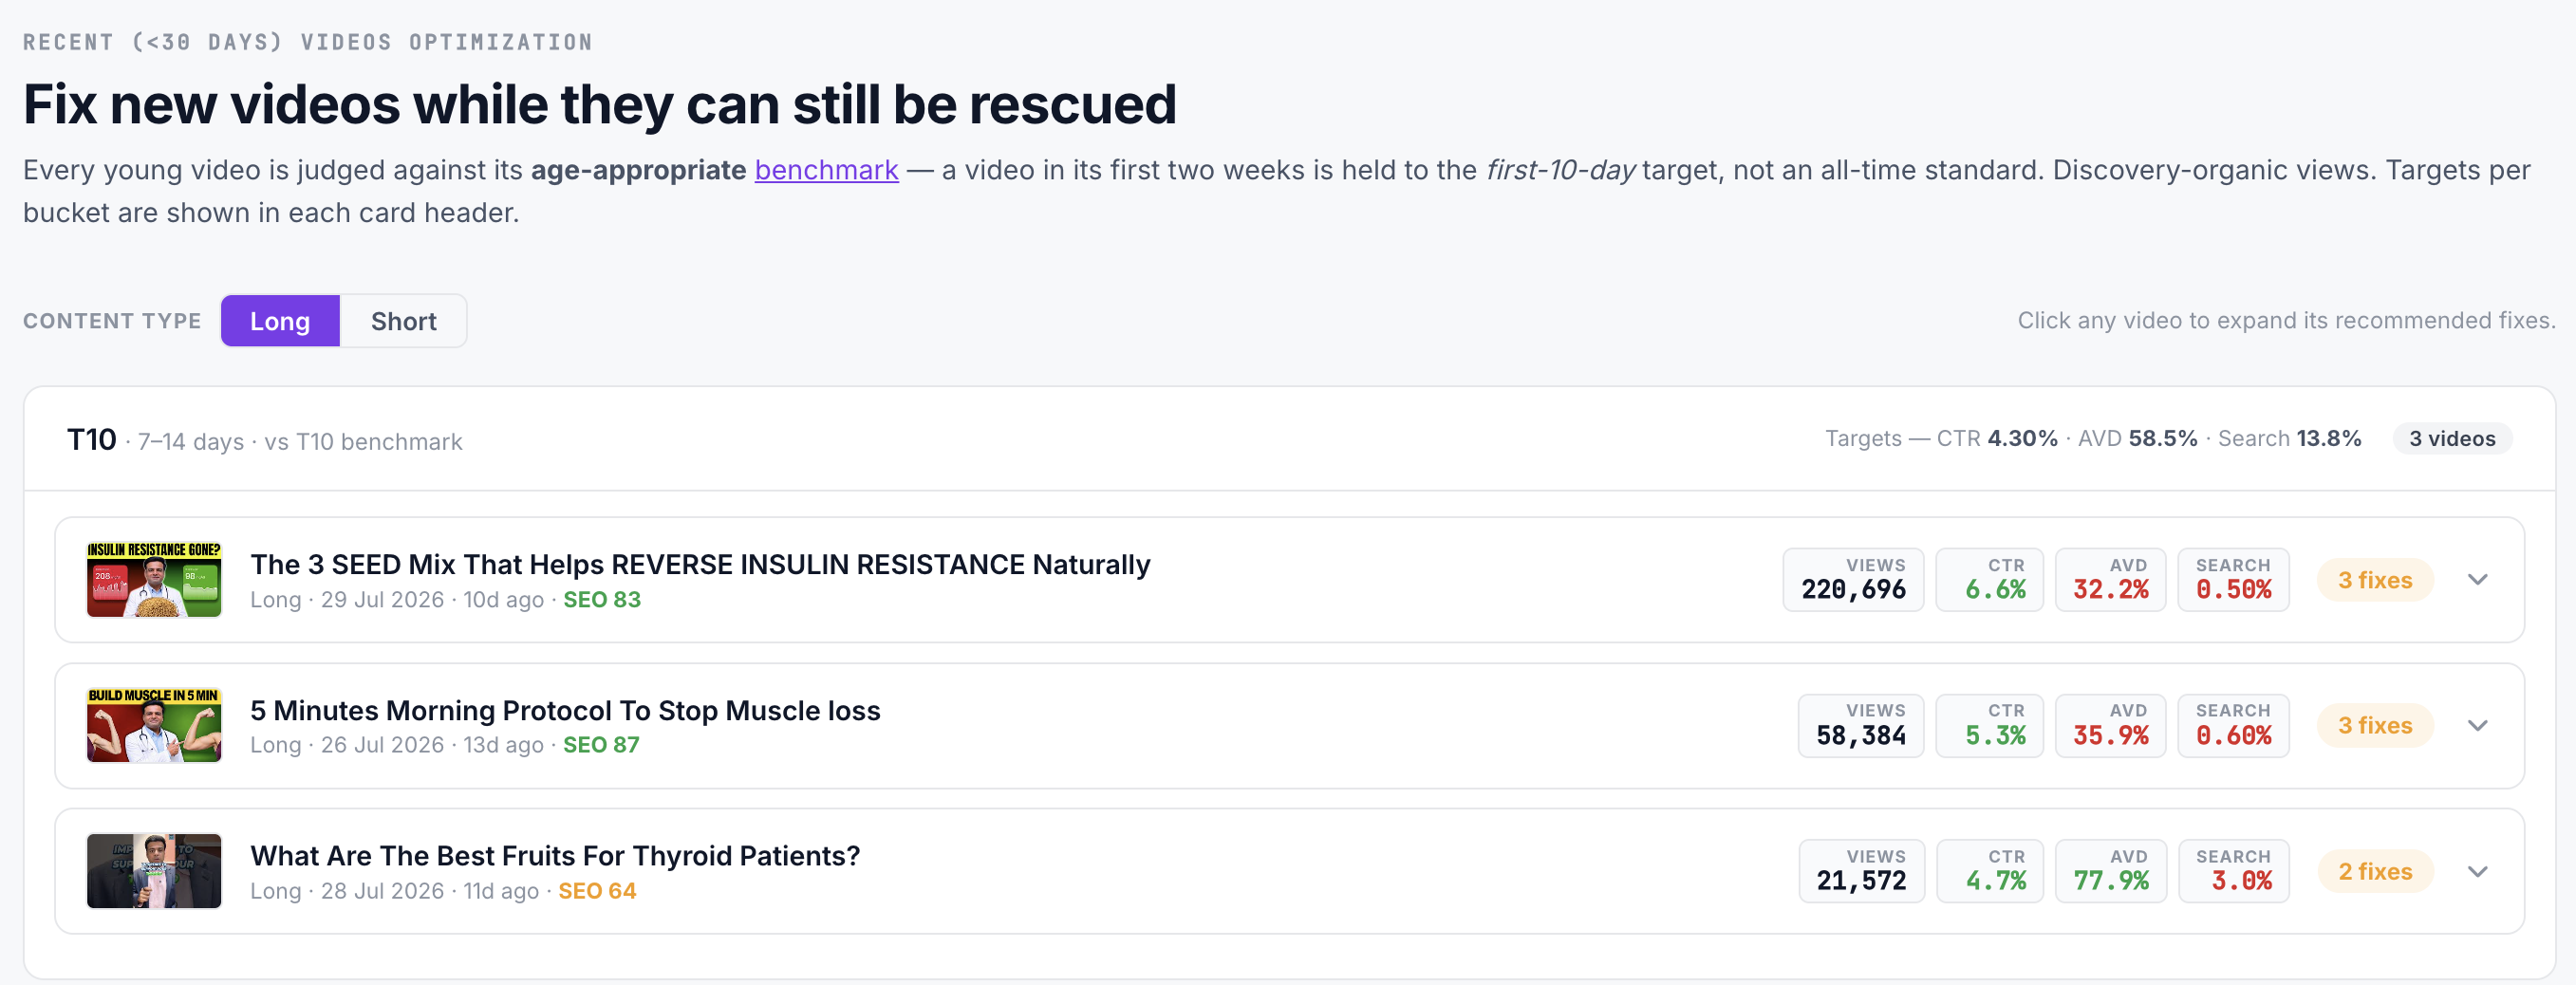
Benchmarks vary by specialty, but the following ranges hold up across the healthcare channels ICG measures. Use them as a diagnostic, not a target. A channel below the range needs script and thumbnail work. A channel above the range needs to protect the moat.
| Specialty cluster | Average view duration | Retention at 30s | Subs to unique-viewer ratio |
|---|---|---|---|
| IVF and fertility | 3:40 to 5:20 | 72 to 84 percent | 1:5 to 1:8 |
| Dental and orthodontics | 2:10 to 3:30 | 65 to 78 percent | 1:6 to 1:10 |
| Cardiology explainers | 4:15 to 6:00 | 70 to 82 percent | 1:4 to 1:7 |
| Dermatology and aesthetics | 1:50 to 3:10 | 62 to 74 percent | 1:7 to 1:12 |
| Oncology second opinion | 5:00 to 7:30 | 75 to 88 percent | 1:3 to 1:6 |
Specialty context matters. A dermatology channel comparing itself to an oncology channel will look terrible on retention and great on volume. Both are misleading. Judge each channel against its own cluster.
How does ICG measure YouTube performance for healthcare clients?
ICG treats YouTube as a lead-source stack, not a content stack. Every video is tagged with a specialty cluster, a city catchment, an intent tier (awareness, comparison, or booking), and a language track. Our YODA product then rolls those tags into a single healthcare-specific dashboard that answers one question: how many verified patient enquiries did each video generate in the last 30 days?
The stack we run typically layers four things. YouTube Studio for the base metrics. Search Console for the external-search overlap. WhatsApp Business API logs for enquiries that landed via video CTAs. And our internal attribution layer that reads UTM-tagged links in end-screens and pinned comments. For hospital groups that already run our Angryturtle GBP OS, we also pipe Google Business Profile call and direction data alongside, because a strong medical channel usually shows a 12 to 22 percent lift in GBP calls in its catchment city within 90 days.
For clients running paid distribution as well, Meta Catalyst IQ handles the Meta Ads engine, Prism Spy watches competitor Meta creative in the specialty, and Prism Pulse tracks Instagram Reels performance so the video team knows which cuts to reformat for YouTube Shorts. Nexus CRM and HealthPro 360 (both at Rs 14,999 per month) capture the enquiries at the far end of the funnel, so we can attribute revenue back to the video, not just clicks.
ICG 70-30 pricing model for YouTube SEO and AIO
ICG's YouTube SEO and AIO retainer follows the same 70-30 fixed-variable model as our search retainer. Foundation starts at Rs 49,999 per month, Growth at Rs 74,999, and Scale at Rs 99,999. 70 percent is fixed against the deliverables (script strategy, thumbnails, chapter markers, transcript hygiene, playlist architecture, analytics reviews). 30 percent is tied to a 12-month target on YouTube-attributed enquiries, released on a sliding-scale slab. Healthcare brands with a YouTube retainer above Rs 50,000 per month get the AIO citation-tracking layer bundled in.
Frequently asked questions


How often should we review YouTube analytics for a medical channel?
Weekly for the top-line health check, monthly for cohort analysis by specialty and language, quarterly for playlist architecture reviews. Anything more frequent than weekly encourages reactive script changes that break long-term retention patterns.
Should Indian medical channels prioritise YouTube Shorts or long-form?
Long-form remains the enquiry-generation engine. Shorts are useful for top-of-funnel discovery and for repurposing already-recorded doctor answers, but they rarely produce direct consultation bookings because the format does not allow enough trust-building for a health decision.
Which language wins on Indian medical channels?
It depends on the catchment. Hindi wins in the North and Central belt for most specialties. English wins for tier-1 aesthetics, IVF, and premium cardiac clusters in Bangalore, Mumbai, and Delhi. Regional languages (Tamil, Telugu, Malayalam, Bengali, Marathi) consistently show 2 to 4 times higher retention than English for equivalent specialty content in their home states.
Can we track AI Overview citations from YouTube inside YouTube Studio?
Not directly. YouTube Studio shows external traffic from Google but does not distinguish AIO citations from standard blue-link clicks. You need to overlay Search Console, brand-search lift, and direct-traffic patterns to infer AIO pickup, which is exactly what YODA does for healthcare clients.
How long before a new medical channel starts showing meaningful analytics data?
Expect 90 to 120 days before retention curves stabilise enough to draw script conclusions. Traffic-source distribution takes 180 days to normalise. Anything before that is noise, especially if the channel is pushing more than two videos per week.
What analytics mistakes do most Indian hospital marketing teams make on YouTube?
Three: measuring subscribers as a primary metric, comparing all videos in a single average instead of by cluster and language, and ignoring the traffic-source report. Any one of these can make a healthy channel look weak or a weak channel look healthy for a full quarter.
Do DPDP Act rules affect how we can use YouTube audience data?
Yes. Under the DPDP Act, sensitive health categories including fertility, oncology, and mental health face stricter consent rules for retargeting. Channel-level analytics inside YouTube Studio remain compliant because they are aggregated, but any downstream audience list built from viewers must have documented consent flows.
Book a free 30-minute Brand & Growth Diagnostic.
It's a working session, not a sales pitch — you leave with a written root-cause analysis you can act on, whether or not you engage ICG.
Questions readers ask
about this topic.
The three platforms
behind every ICG engagement.
Beacon
CAPI middleware that fixes Event Match Quality, translates CRM statuses to Meta-standard events, dedups across channels.
Agency OS
Live client dashboard. GSC, GA4, Google Ads, Meta Ads, IVR calls in one view. Login anytime, not monthly.
Phoenix
Clinic revenue intelligence over your PMS. Daily action queue: Prevent Loss, Maintain & Engage, Grow Revenue. 46-centre rollout.
Or book a free 30-min audit to see all three in action on your account.
Healthcare brands
that already run on ICG.
A representative slice of the 150+ healthcare brands ICG has delivered for across India. Most engagements remain under NDA.


What ICG clients say · on video.
"Scale up of organic channels and business consulting. ICG has absolute domain authority in their field."
"Working with ICG transformed how we acquire IVF patients in Gurgaon. They understand the fertility journey from inquiry to consult..."
"What Ichelon accomplished — they got all my ideas and worked over 3-4 months to create an amazing, super-customised website."
Need help operationalising this?
Every ICG service is healthcare-only, NMC + DPDP-aware, and built around the patient-research patterns that drive Indian healthcare growth in 2026.
More from
ICG.
Healthcare AIO is the discipline of getting your clinic or hospital cited inside Google AI Overviews, ChatGPT and Perplexity answers — not j...
Conversational-search advertising places brand messages inside AI chat answers — ChatGPT, Perplexity, Copilot — rather than beside a results...
NABH digital compliance means every claim, image and testimonial your hospital publishes online matches what an accreditation surveyor can v...
Stop guessing.
Book a Diagnostic.
30 minutes. Free. With the AI-powered healthcare-only marketing agency 150+ brands already run on. No slides, no pitch, no hard close.


